아두이노 WebPlotter 예제 실시간 데이터 시각화 튜토리얼
개요
WebPlotter 예제는 모든 웹 브라우저에서 접근 가능한 실시간 데이터 시각화 인터페이스를 생성합니다. Arduino Uno R4 WiFi 및 DIYables STEM V4 IoT용으로 설계된 교육 플랫폼으로, 향상된 데이터 처리 기능, 실시간 플롯 기능 및 센서 모니터링 시스템과의 매끄러운 통합을 제공합니다. 센서 데이터를 시각화하고 알고리즘을 디버깅하거나 실시간으로 시스템 성능을 모니터링하는 데에 이상적입니다.
주요 기능
- 실시간 데이터 시각화: Arduino에서 스트리밍되는 센서 데이터를 시각화합니다
- 다중 데이터 시리즈: 최대 8개의 서로 다른 데이터 스트림을 동시에 그래프로 표시합니다
- 자동 스케일링: 데이터 범위를 기반으로 Y축을 자동으로 조정합니다
- 대화형 인터페이스: 확대/축소(줌), 패닝, 데이터 추세 분석
- 웹소켓 통신: 지연 시간이 최소화된 실시간 업데이트
- 반응형 디자인: 데스크탑, 태블릿 및 모바일 기기에서 작동합니다
- 사용자 정의 가능한 구성: 플롯 제목, 축 레이블 및 범위를 조정할 수 있습니다
- 플랫폼 확장 가능성: 현재 Arduino Uno R4 WiFi용으로 구현되어 있지만, 다른 하드웨어 플랫폼으로도 확장할 수 있습니다. 아래를 참고하십시오: DIYables_WebApps_ESP32
준비물
| 1 | × | 아두이노 우노 R4 와이파이 | 쿠팡 | 아마존 | |
| 1 | × | (또는) DIYables STEM V4 IoT | 쿠팡 | 아마존 | |
| 1 | × | USB 케이블 타입-A to 타입-C (USB-A PC용) | 쿠팡 | 아마존 | |
| 1 | × | USB 케이블 타입-C to 타입-C (USB-C PC용) | 아마존 | |
| 1 | × | (추천) 아두이노 우노 R4용 스크루 터미널 블록 쉴드 | 쿠팡 | 아마존 | |
| 1 | × | (추천) Sensors/Servo Expansion Shield for Arduino UNO R4 | 쿠팡 | 아마존 | |
| 1 | × | (추천) 아두이노 우노 R4용 브레드보드 쉴드 | 쿠팡 | 아마존 | |
| 1 | × | (추천) 아두이노 우노 R4용 케이스 | 쿠팡 | 아마존 | |
| 1 | × | (추천) 아두이노 우노 R4용 전원 분배기 | 쿠팡 | 아마존 | |
| 1 | × | (추천) 아두이노 우노용 프로토타이핑 베이스 플레이트 & 브레드보드 키트 | 아마존 |
공개: 이 포스팅 에 제공된 일부 링크는 아마존 제휴 링크입니다. 이 포스팅은 쿠팡 파트너스 활동의 일환으로, 이에 따른 일정액의 수수료를 제공받습니다.
설정 지침
빠른 단계
다음 지침을 단계별로 따라가세요:
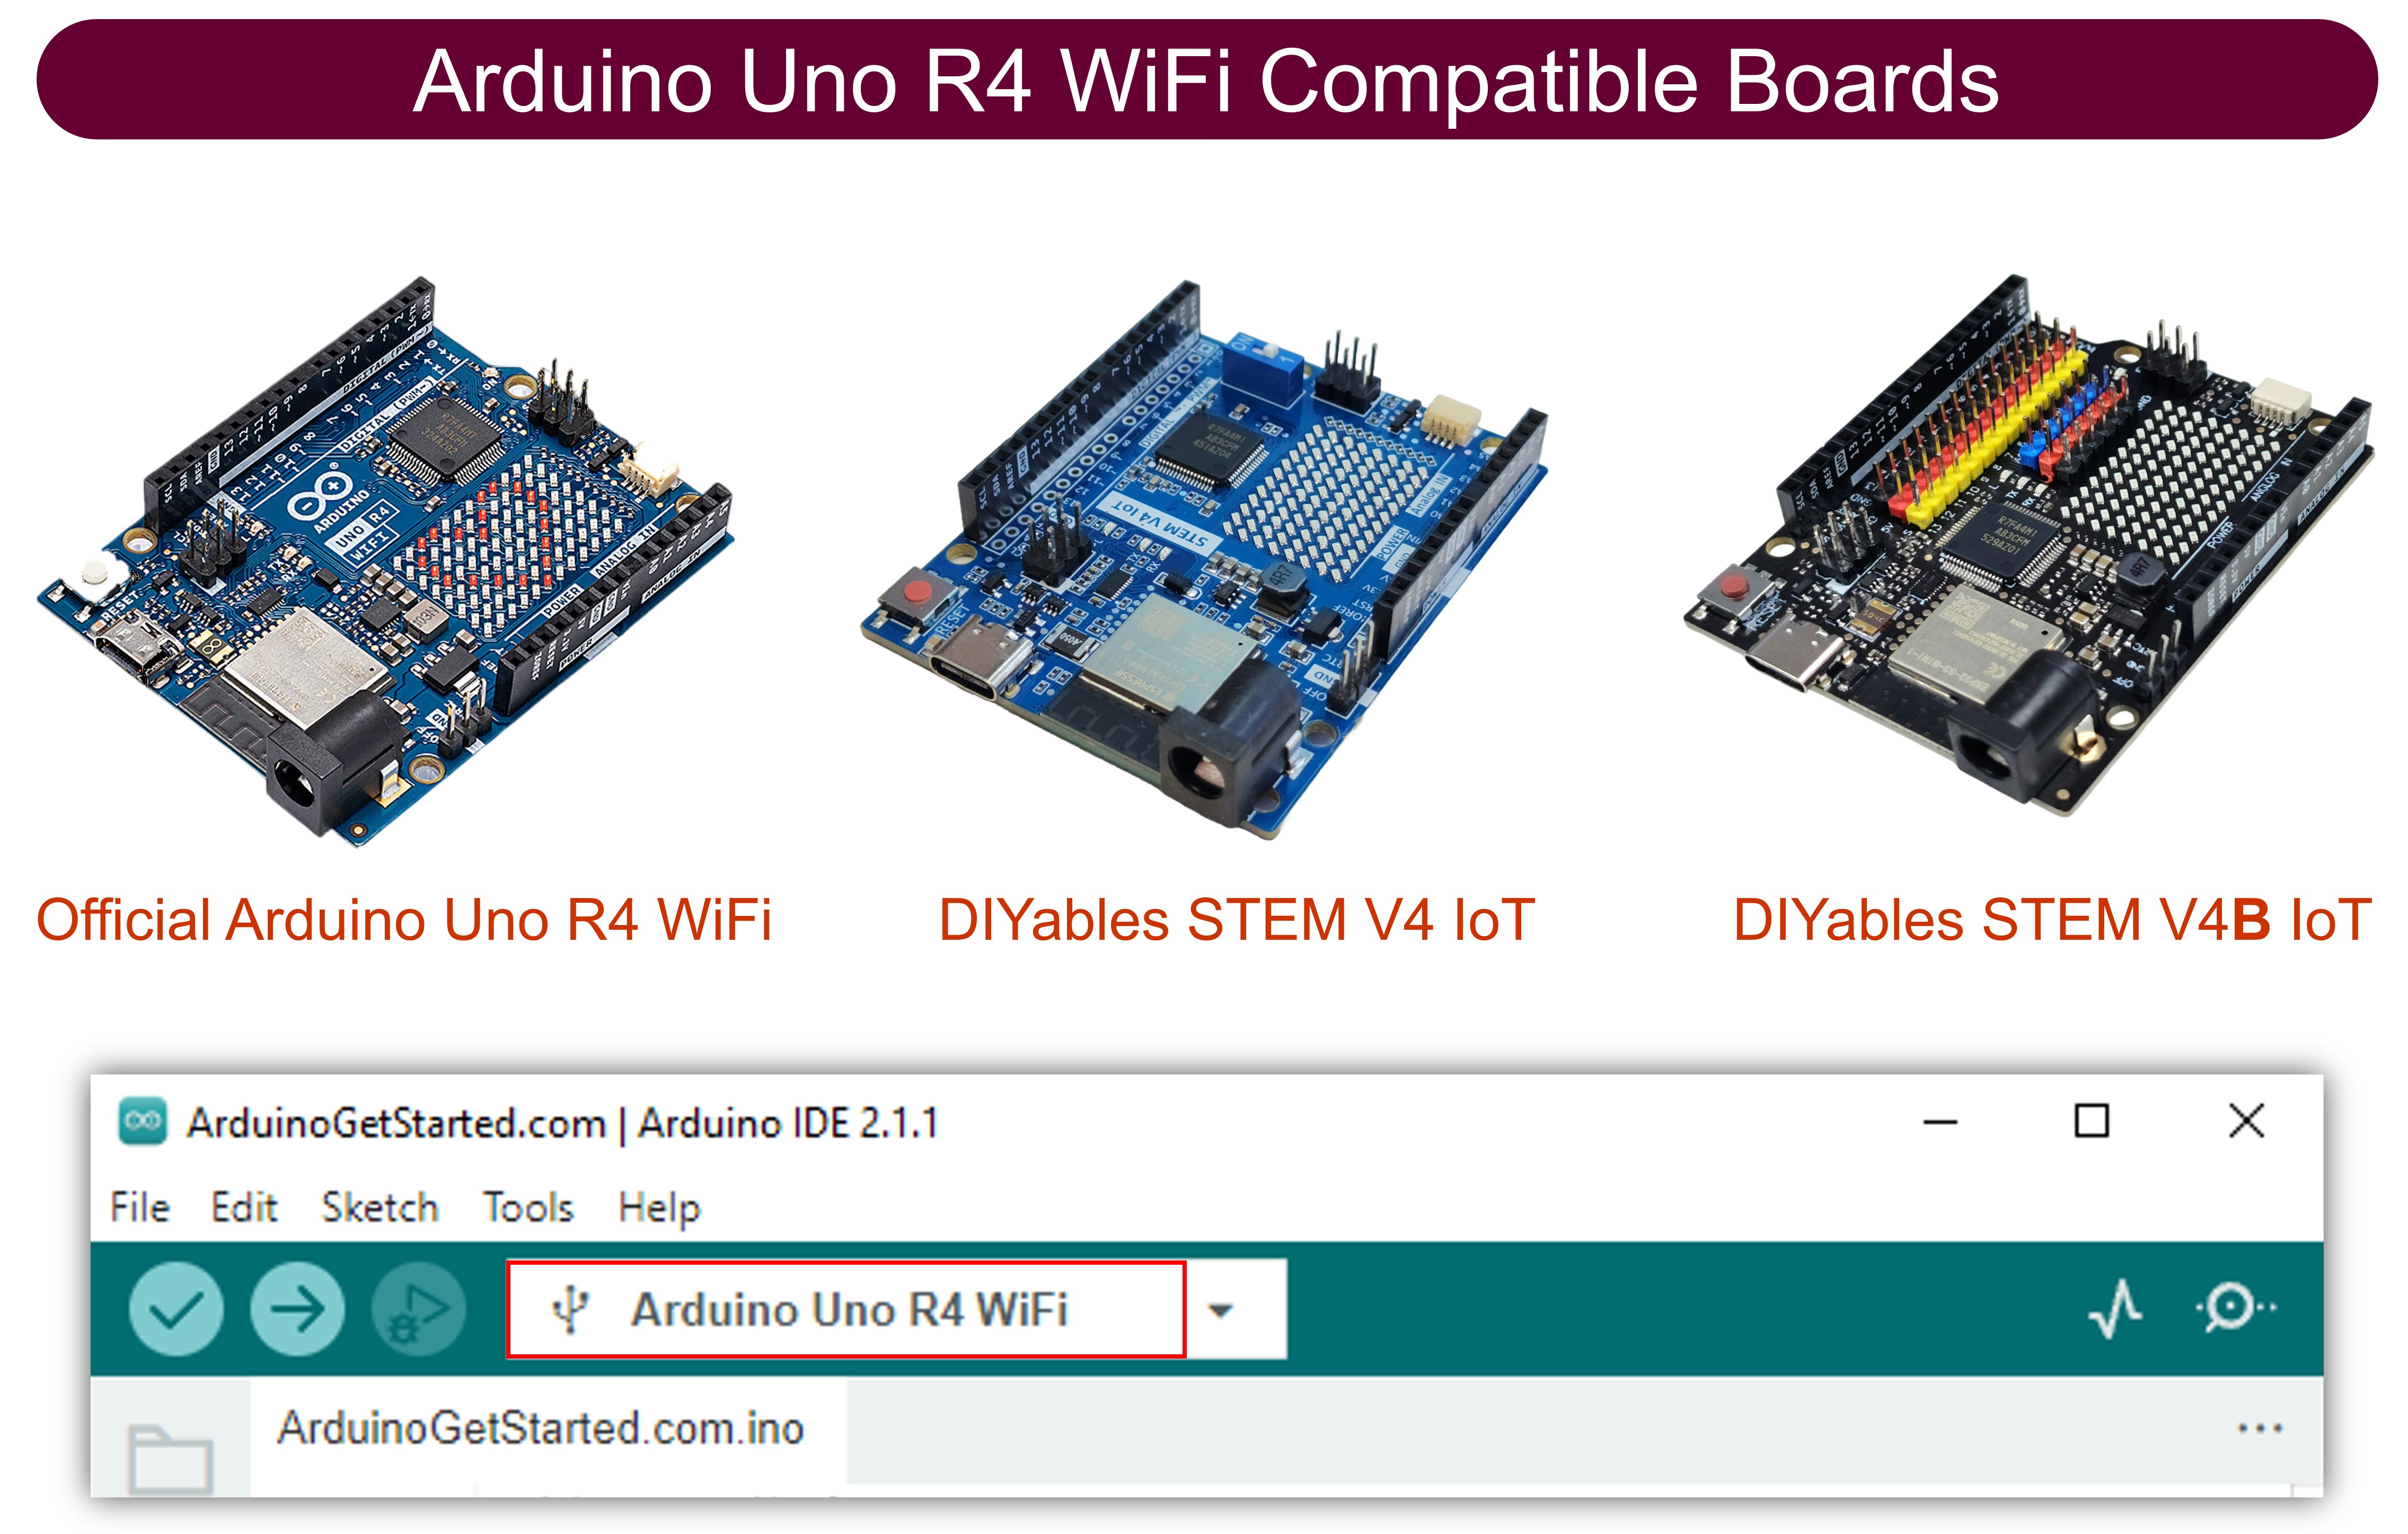
- 만약 이것이 Arduino Uno R4 WiFi/DIYables STEM V4 IoT를 처음 사용하는 경우 Arduino IDE에서 Arduino Uno R4 WiFi/DIYables STEM V4 IoT용 환경 설정 튜토리얼을 참조하세요. 아두이노 우노 R4 - 소프트웨어 설치.
- USB 케이블을 사용하여 Arduino Uno R4/DIYables STEM V4 IoT 보드를 컴퓨터에 연결합니다.
- 컴퓨터에서 Arduino IDE를 실행합니다.
- 적절한 Arduino Uno R4 보드(예: Arduino Uno R4 WiFi)와 COM 포트를 선택합니다.
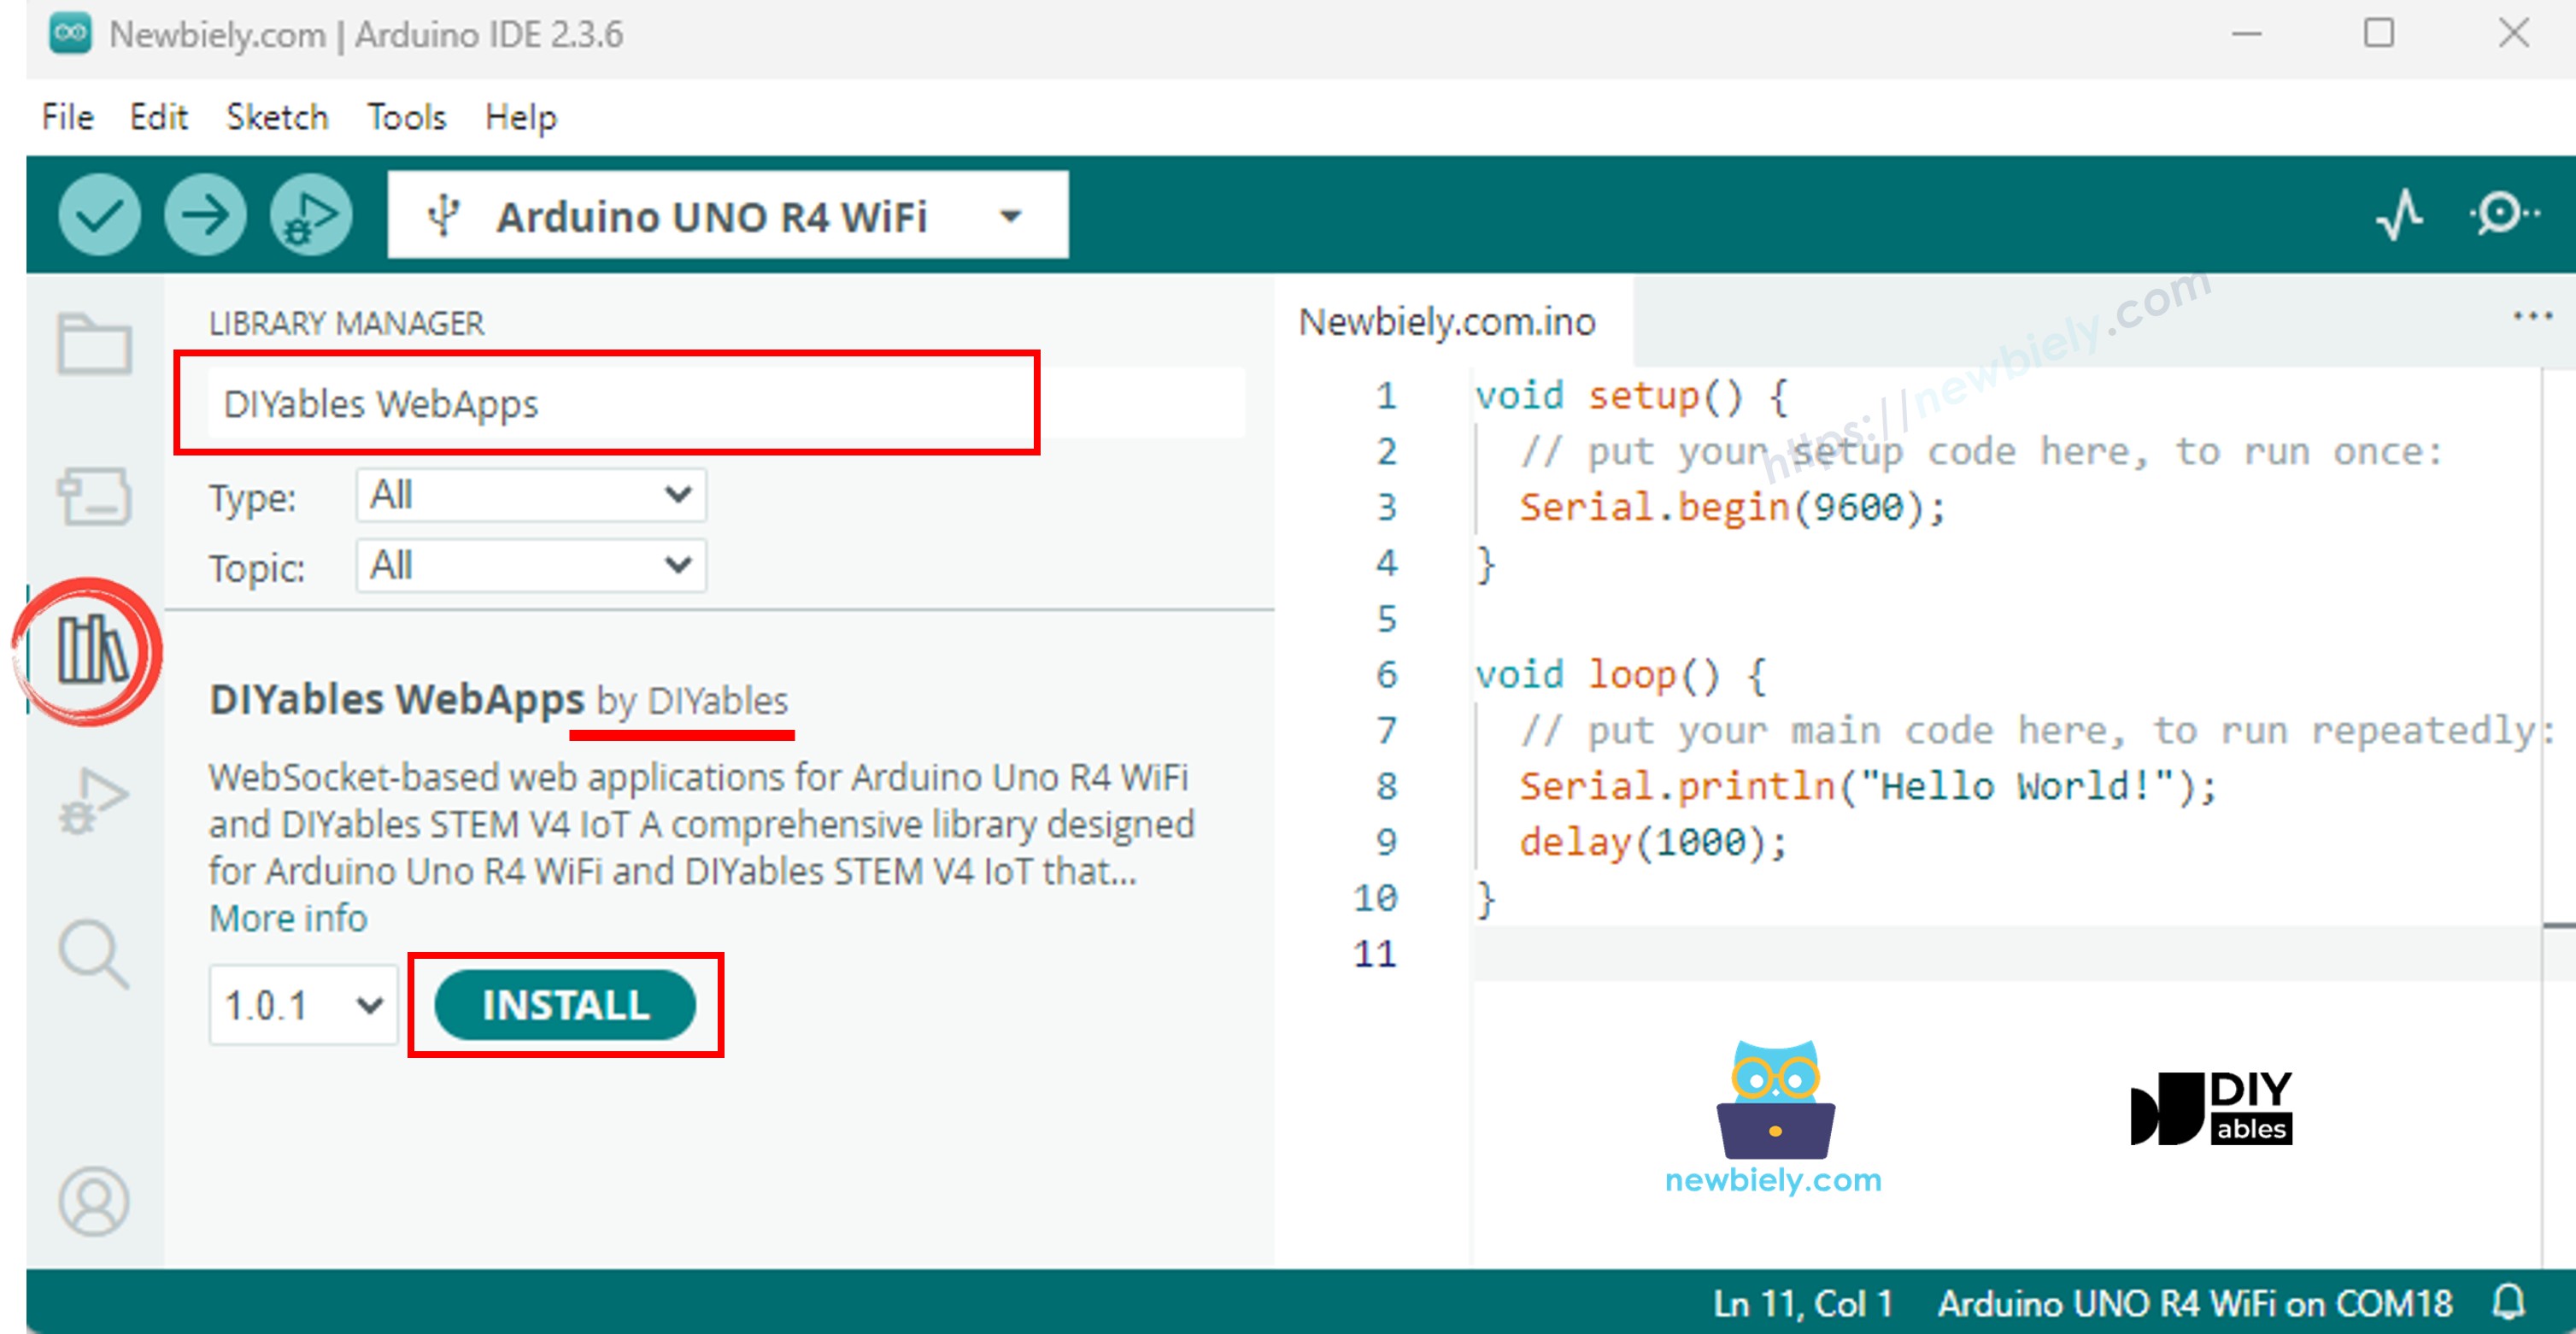
- Arduino IDE의 왼쪽 바에서 Libraries 아이콘으로 이동합니다.
- "DIYables WebApps"를 검색한 다음 DIYables에서 만든 DIYables WebApps 라이브러리를 찾습니다.
- 라이브러리를 설치하려면 Install 버튼을 클릭합니다.
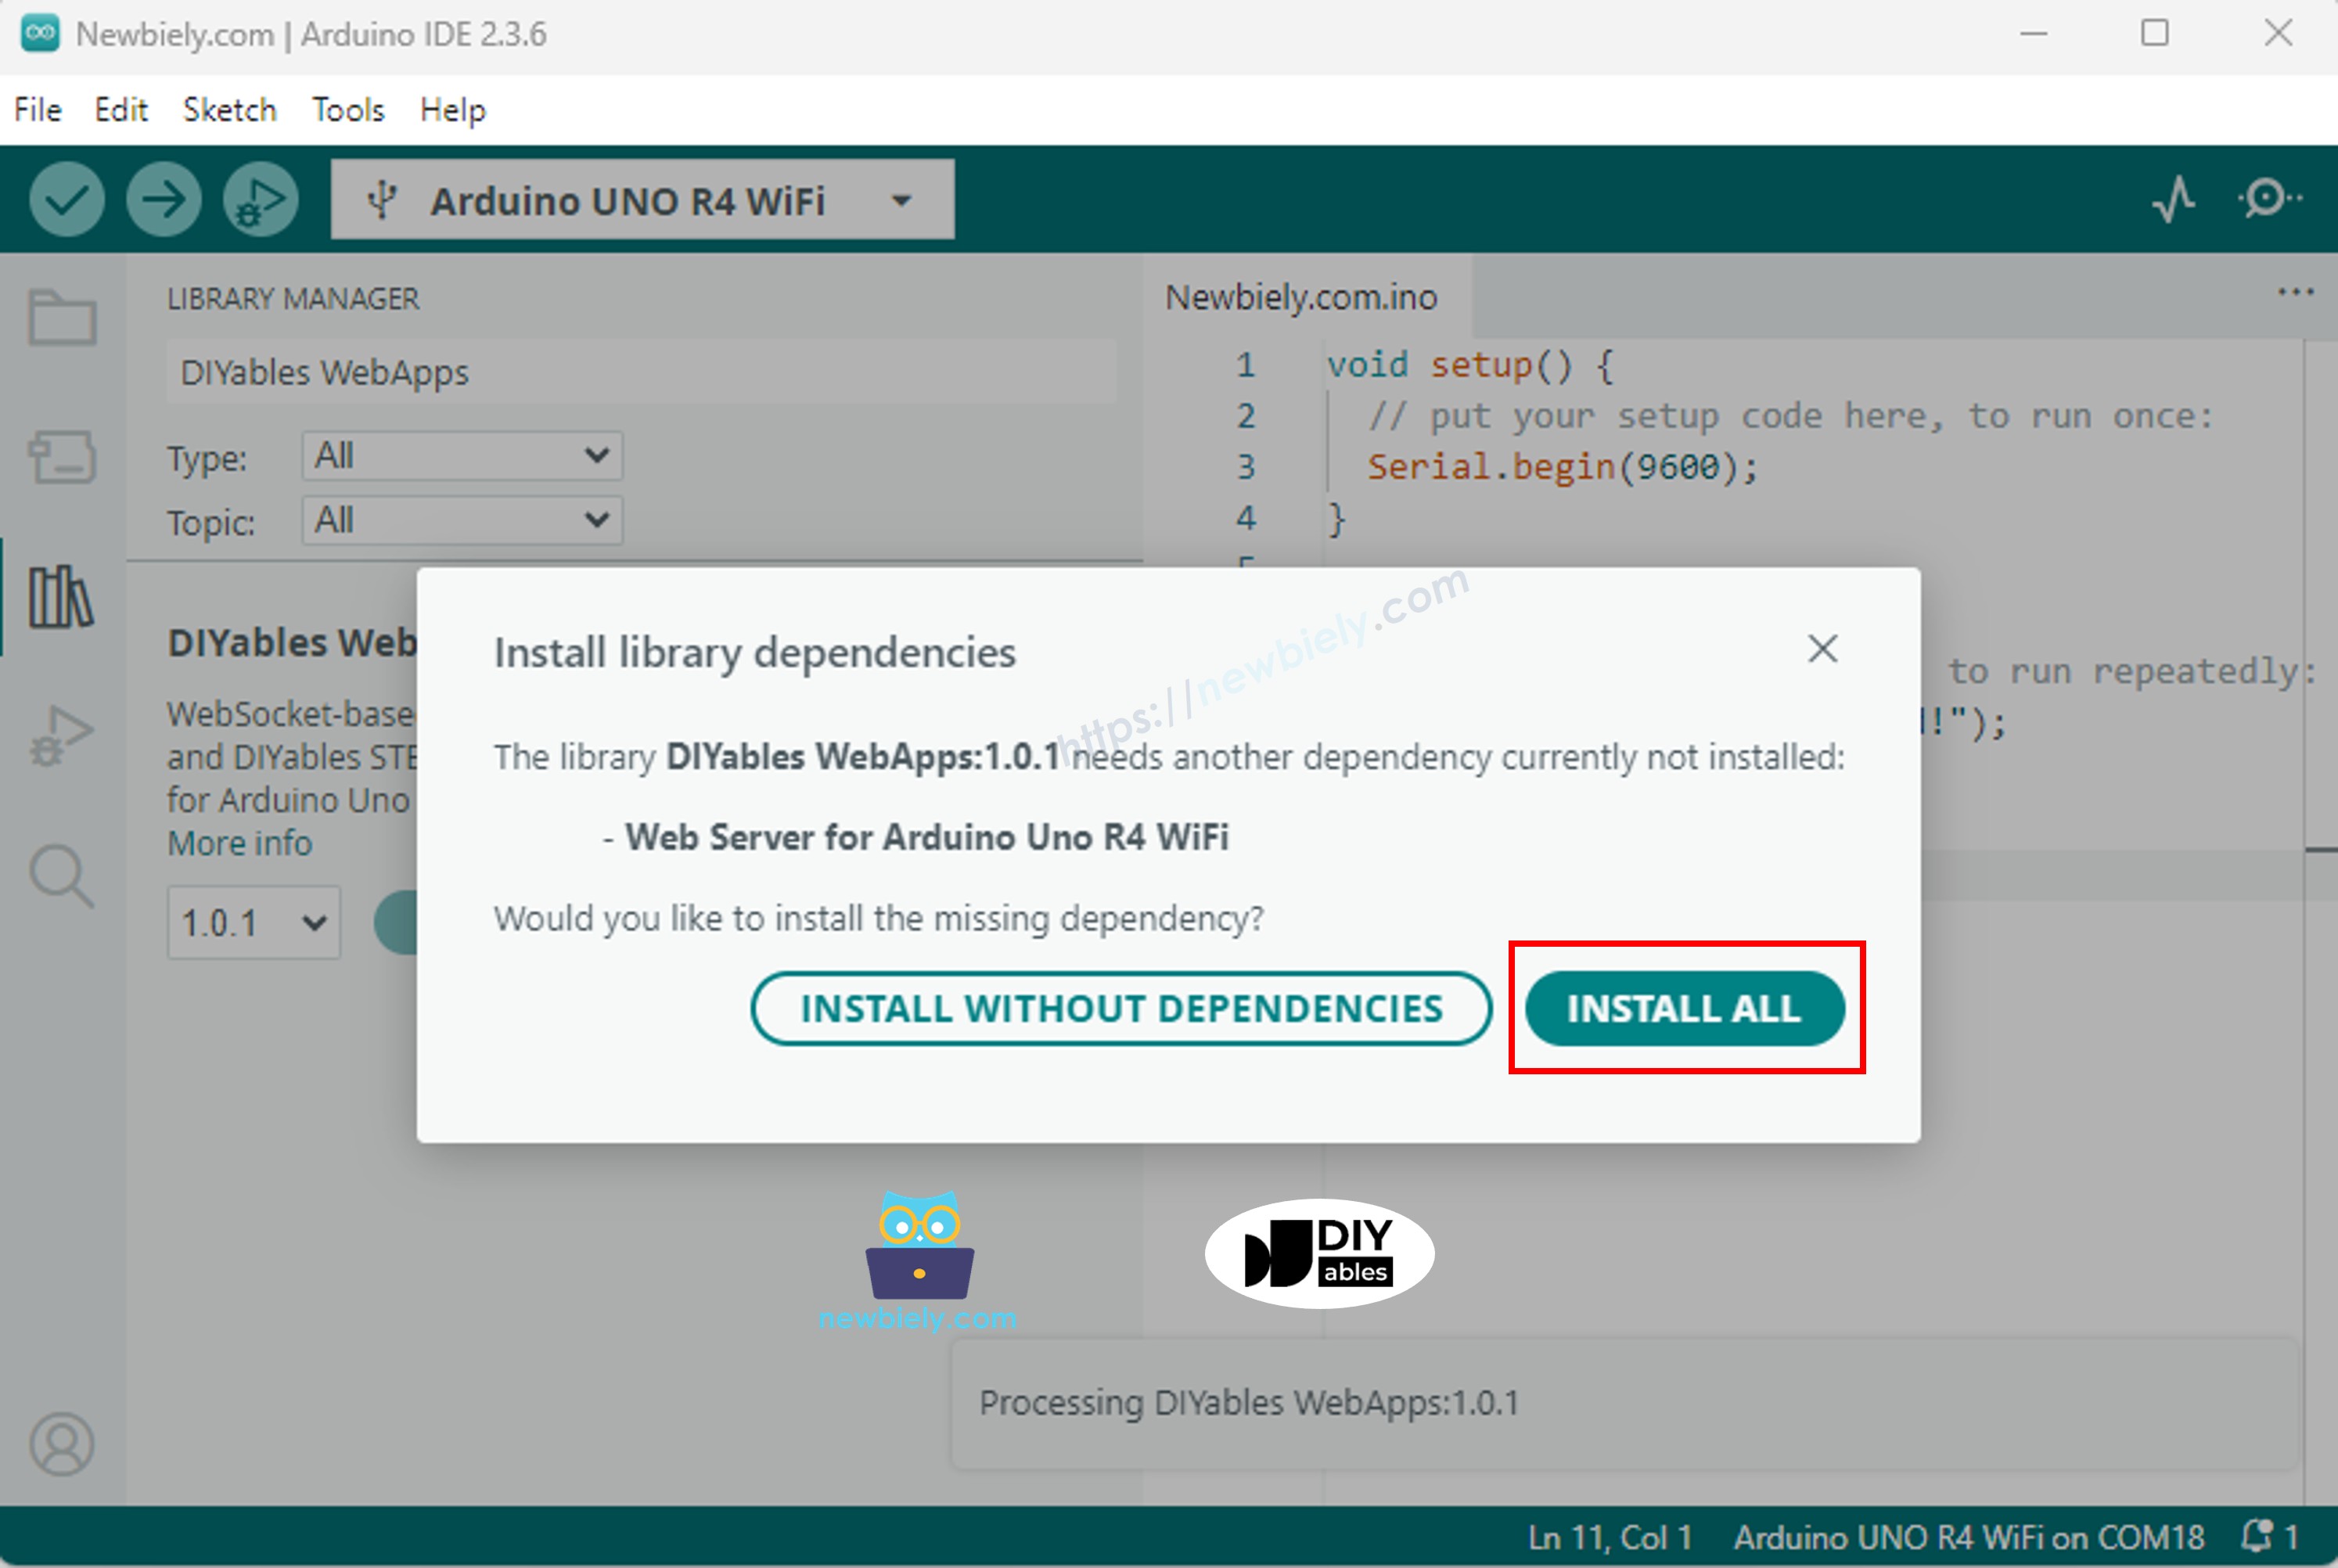
- 다른 라이브러리 의존성 설치를 요청받게 됩니다.
- 모든 라이브러리 의존성을 설치하려면 Install All 버튼을 클릭하세요.
- Arduino IDE에서 File 예제 DIYables WebApps WebPlotter 예제로 이동하거나 위의 코드를 복사하여 Arduino IDE의 편집기에 붙여넣으세요
/*
* DIYables WebApp Library - Web Plotter Example
*
* This example demonstrates the Web Plotter feature:
* - Real-time data visualization
* - Multiple data series support
* - Auto-scaling Y-axis
* - Responsive web interface
* - WebSocket communication for instant updates
*
* Hardware: Arduino Uno R4 WiFi or DIYables STEM V4 IoT
*
* Setup:
* 1. Update WiFi credentials below
* 2. Upload the sketch to your Arduino
* 3. Open Serial Monitor to see the IP address
* 4. Navigate to http://[IP_ADDRESS]/webplotter
*/
#include <DIYablesWebApps.h>
// WiFi credentials - UPDATE THESE WITH YOUR NETWORK
const char WIFI_SSID[] = "YOUR_WIFI_SSID";
const char WIFI_PASSWORD[] = "YOUR_WIFI_PASSWORD";
// Create WebApp server and page instances
UnoR4ServerFactory serverFactory;
DIYablesWebAppServer webAppsServer(serverFactory, 80, 81);
DIYablesHomePage homePage;
DIYablesWebPlotterPage webPlotterPage;
// Simulation variables
unsigned long lastDataTime = 0;
const unsigned long DATA_INTERVAL = 1000; // Send data every 1000ms
float timeCounter = 0;
void setup() {
Serial.begin(9600);
delay(1000);
// TODO: Initialize your hardware pins and sensors here
Serial.println("DIYables WebApp - Web Plotter Example");
// Add home and web plotter pages
webAppsServer.addApp(&homePage);
webAppsServer.addApp(&webPlotterPage);
// Optional: Add 404 page for better user experience
webAppsServer.setNotFoundPage(DIYablesNotFoundPage());
// Configure the plotter
webPlotterPage.setPlotTitle("Real-time Data Plotter");
webPlotterPage.setAxisLabels("Time (s)", "Values");
webPlotterPage.enableAutoScale(true);
webPlotterPage.setMaxSamples(50);
// Start the WebApp server
if (!webAppsServer.begin(WIFI_SSID, WIFI_PASSWORD)) {
while (1) {
Serial.println("Failed to start WebApp server!");
delay(1000);
}
}
// Set up callbacks
webPlotterPage.onPlotterDataRequest([]() {
Serial.println("Web client requested data");
sendSensorData();
});
Serial.println("\nWebPlotter is ready!");
Serial.println("Usage Instructions:");
Serial.println("1. Connect to the WiFi network");
Serial.println("2. Open your web browser");
Serial.println("3. Navigate to the Arduino's IP address");
Serial.println("4. Click on 'Web Plotter' to view real-time data");
Serial.println("\nGenerating simulated sensor data...");
}
void loop() {
// Handle web server and WebSocket connections
webAppsServer.loop();
// Send sensor data at regular intervals
if (millis() - lastDataTime >= DATA_INTERVAL) {
lastDataTime = millis();
sendSensorData();
timeCounter += DATA_INTERVAL / 1000.0; // Convert to seconds
}
}
void sendSensorData() {
// Generate simulated sensor data
// In a real application, replace these with actual sensor readings
// Simulated temperature sensor (sine wave with noise)
float temperature = 25.0 + 5.0 * sin(timeCounter * 0.5) + random(-100, 100) / 100.0;
// Simulated humidity sensor (cosine wave)
float humidity = 50.0 + 20.0 * cos(timeCounter * 0.3);
// Simulated light sensor (triangle wave)
float light = 512.0 + 300.0 * (2.0 * abs(fmod(timeCounter * 0.2, 2.0) - 1.0) - 1.0);
// Simulated analog pin reading
float analogValue = analogRead(A0);
// Send data using different methods:
// Method 1: Send individual values (uncomment to use)
// webPlotterPage.sendPlotData(temperature);
// Method 2: Send multiple values at once
webPlotterPage.sendPlotData(temperature, humidity, light / 10.0, analogValue / 100.0);
// Method 3: Send array of values (alternative approach)
// float values[] = {temperature, humidity, light / 10.0, analogValue / 100.0};
// webPlotterPage.sendPlotData(values, 4);
// Method 4: Send raw data string (for custom formatting)
// String dataLine = String(temperature, 2) + " " + String(humidity, 1) + " " + String(light / 10.0, 1);
// webPlotterPage.sendPlotData(dataLine);
// Print to Serial Monitor in Serial Plotter compatible format
// Format: Temperature Humidity Light Analog (tab-separated for Serial Plotter)
Serial.print(temperature, 1);
Serial.print("\t");
Serial.print(humidity, 1);
Serial.print("\t");
Serial.print(light / 10.0, 1);
Serial.print("\t");
Serial.println(analogValue / 100.0, 2);
}
- 코드에서 WiFi 자격 증명을 구성하려면 다음 줄들을 업데이트하십시오:
const char WIFI_SSID[] = "YOUR_WIFI_NETWORK";
const char WIFI_PASSWORD[] = "YOUR_WIFI_PASSWORD";
- Arduino IDE에서 Upload 버튼을 클릭하여 Arduino UNO R4/DIYables STEM V4 IoT에 코드를 업로드합니다
- 시리얼 모니터를 엽니다
- 시리얼 모니터에서 결과를 확인합니다. 아래와 같이 보입니다.
8
Serial.println("Hello World!");
Message (Enter to send message to 'Arduino Uno R4 WiFi' on 'COM15')
New Line
9600 baud
DIYables WebApp - Web Plotter Example
INFO: Added app /
INFO: Added app /web-plotter
DIYables WebApp Library
Platform: Arduino Uno R4 WiFi
Network connected!
IP address: 192.168.0.2
HTTP server started on port 80
Configuring WebSocket server callbacks...
WebSocket server started on port 81
WebSocket URL: ws://192.168.0.2:81
WebSocket server started on port 81
==========================================
DIYables WebApp Ready!
==========================================
📱 Web Interface: http://192.168.0.2
🔗 WebSocket: ws://192.168.0.2:81
📋 Available Applications:
🏠 Home Page: http://192.168.0.2/
📊 Web Plotter: http://192.168.0.2/web-plotter
==========================================
- 아무 것도 보이지 않으면 Arduino 보드를 재부팅하십시오.
- 표시된 IP 주소를 메모해 두고, 이 주소를 스마트폰이나 PC의 웹 브라우저 주소 표시줄에 입력하세요.
- 예: http://192.168.0.2
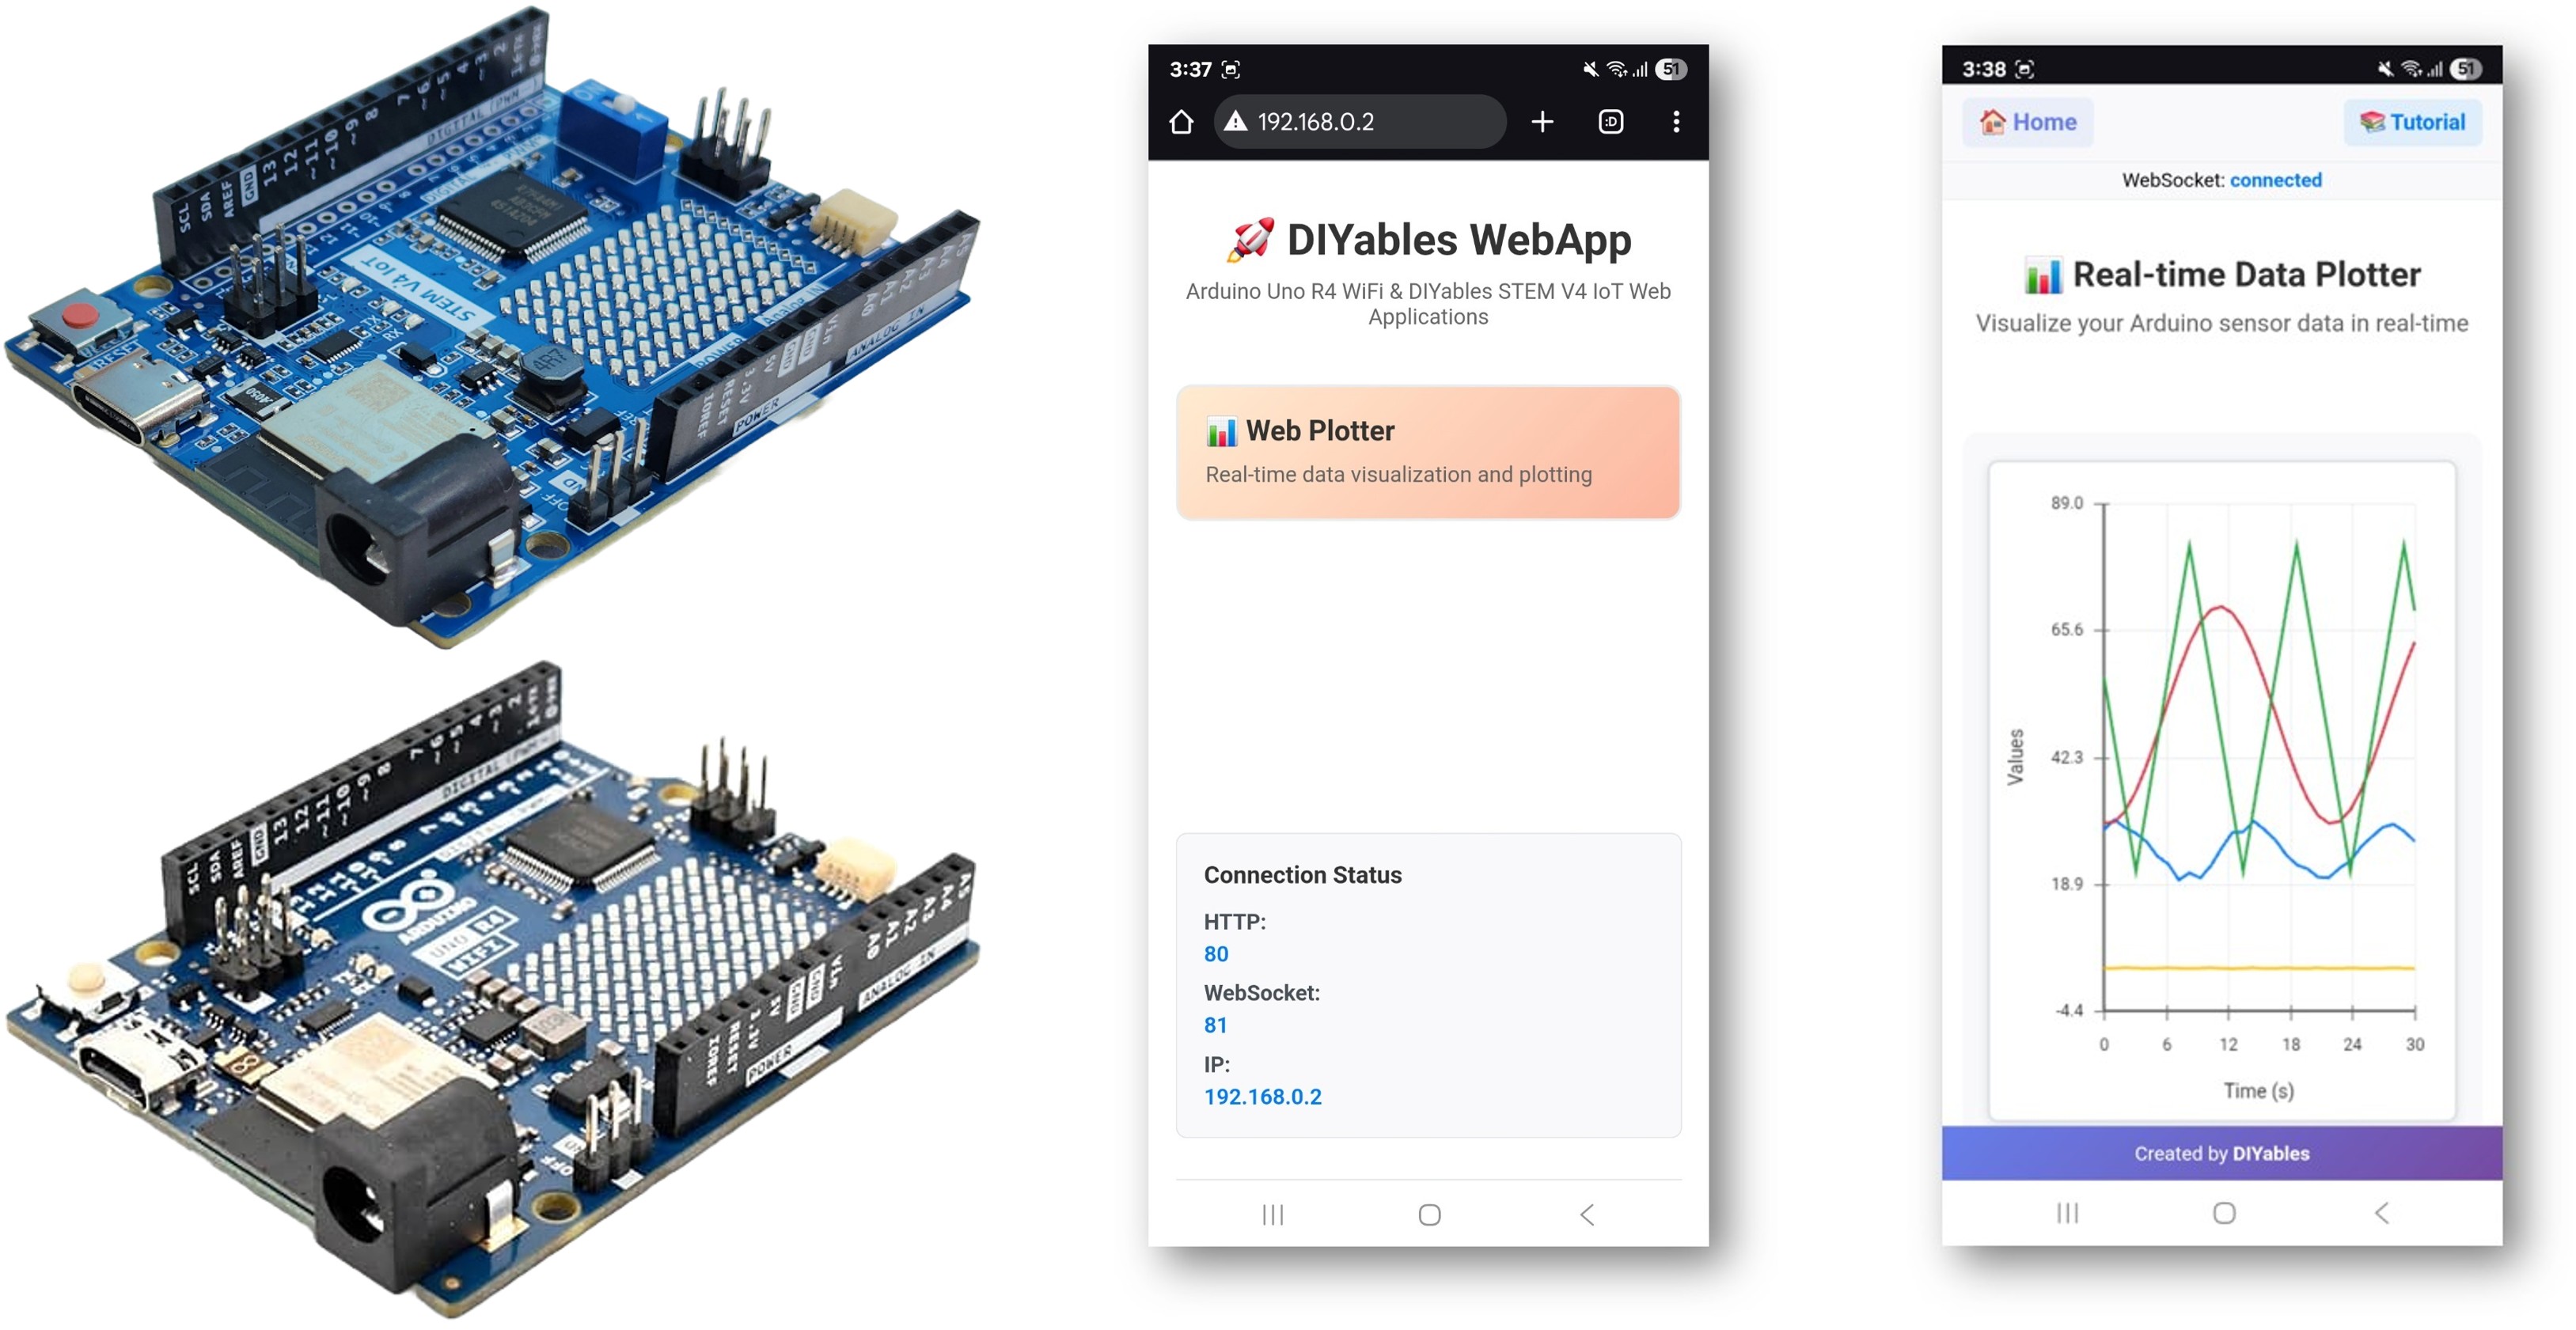
- 다음 이미지와 같은 홈 페이지가 표시됩니다:
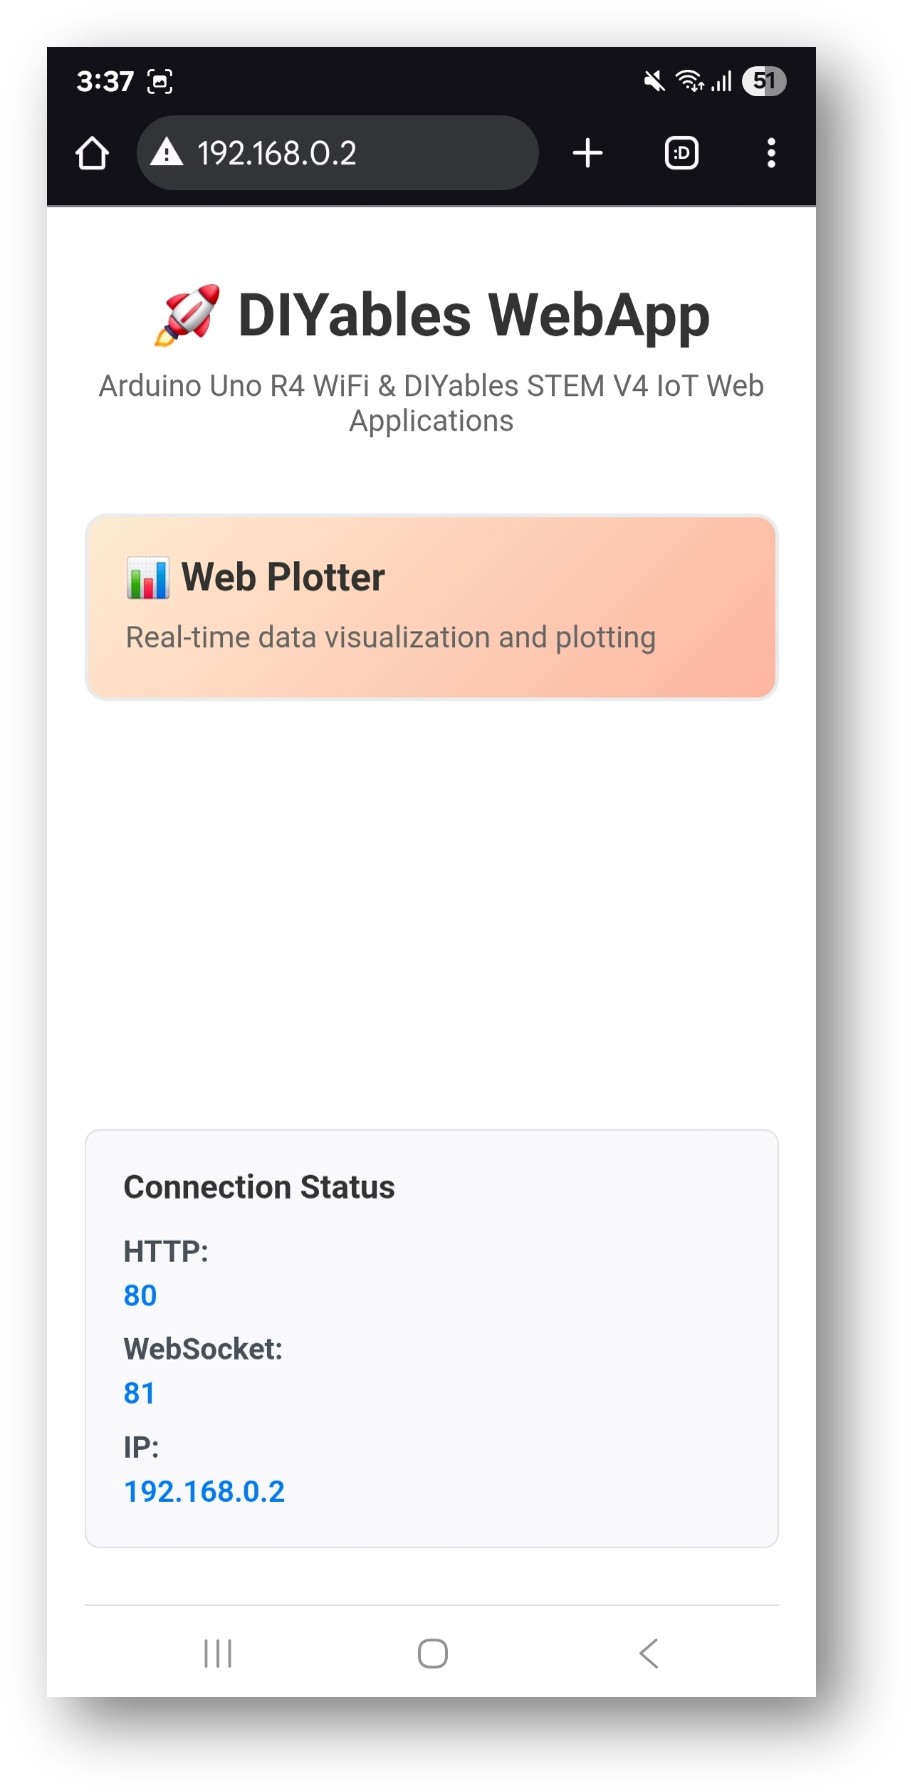
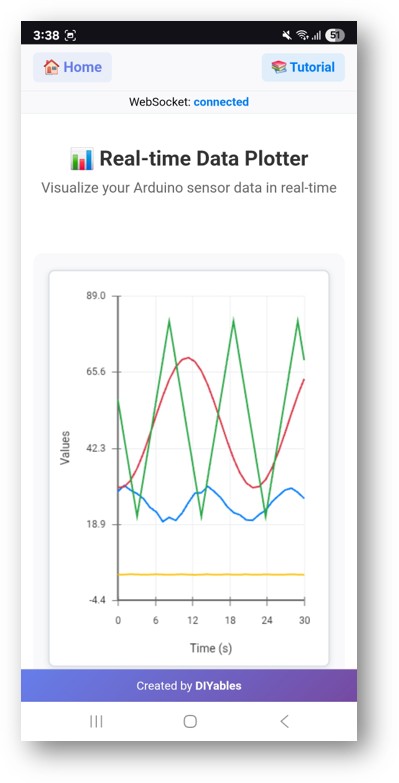
- Web Plotter 링크를 클릭하면 아래와 같이 Web Plotter 앱의 UI가 보일 것입니다:
- 또한 IP 주소 뒤에 '/web-plotter'를 붙여 페이지에 직접 접속할 수도 있습니다. 예: http://192.168.0.2/web-plotter
- Arduino가 시뮬레이션된 센서 데이터를 생성하고 이를 실시간으로 그래프로 표시하는 모습을 보게 됩니다. 서로 다른 데이터 스트림을 나타내는 여러 색상의 선이 나타납니다.
창의적인 맞춤화 - 당신의 데이터를 창의적으로 시각화하기
그래프 그리기 인터페이스를 고유한 프로젝트 요구사항에 맞게 조정하고, 멋진 데이터 시각화를 만들어 보세요:
데이터 소스 구성
시뮬레이션 데이터를 실제 센서 측정값으로 교체하십시오:
방법 1: 단일 센서 읽기
void sendTemperatureData() {
float temperature = analogRead(A0) * (5.0 / 1023.0) * 100; // LM35 temperature sensor
webPlotterPage.sendPlotData(temperature);
}
방법 2: 다중 센서
void sendMultipleSensors() {
float temperature = readTemperature();
float humidity = readHumidity();
float light = analogRead(A1) / 10.0;
float pressure = readPressure();
webPlotterPage.sendPlotData(temperature, humidity, light, pressure);
}
방법 3: 값의 배열
void sendSensorArray() {
float sensors[6] = {
analogRead(A0) / 10.0, // Sensor 1
analogRead(A1) / 10.0, // Sensor 2
analogRead(A2) / 10.0, // Sensor 3
digitalRead(2) * 50, // Digital state
millis() / 1000.0, // Time counter
random(0, 100) // Random data
};
webPlotterPage.sendPlotData(sensors, 6);
}
그래프 커스터마이징
맞춤형 플롯 외관
void setupCustomPlot() {
webPlotterPage.setPlotTitle("Environmental Monitoring Station");
webPlotterPage.setAxisLabels("Time (minutes)", "Sensor Readings");
webPlotterPage.setYAxisRange(0, 100); // Fixed Y-axis range
webPlotterPage.setMaxSamples(100); // Show more data points
}
동적 구성
void setupDynamicPlot() {
webPlotterPage.setPlotTitle("Smart Garden Monitor");
webPlotterPage.setAxisLabels("Sample #", "Values");
webPlotterPage.enableAutoScale(true); // Auto-adjust Y-axis
// Configure callbacks for interactive features
webPlotterPage.onPlotterDataRequest([]() {
Serial.println("Client connected - sending initial data");
sendInitialDataBurst();
});
}
고급 데이터 처리
이동 평균 필터
float movingAverage(float newValue) {
static float readings[10];
static int index = 0;
static float total = 0;
total -= readings[index];
readings[index] = newValue;
total += readings[index];
index = (index + 1) % 10;
return total / 10.0;
}
void sendFilteredData() {
float rawValue = analogRead(A0);
float filteredValue = movingAverage(rawValue);
webPlotterPage.sendPlotData(rawValue / 10.0, filteredValue / 10.0);
}
타임스탬프가 있는 데이터 로깅
void sendTimestampedData() {
unsigned long currentTime = millis() / 1000;
float sensorValue = analogRead(A0) / 10.0;
// Send time and value as separate data series
webPlotterPage.sendPlotData(currentTime, sensorValue);
// Also log to Serial for debugging
Serial.print("Time: ");
Serial.print(currentTime);
Serial.print("s, Value: ");
Serial.println(sensorValue);
}
통합 예시
환경 모니터링
#include <DHT.h>
#define DHT_PIN 2
#define DHT_TYPE DHT22
DHT dht(DHT_PIN, DHT_TYPE);
void sendEnvironmentalData() {
float temperature = dht.readTemperature();
float humidity = dht.readHumidity();
float lightLevel = analogRead(A0) / 10.0;
if (!isnan(temperature) && !isnan(humidity)) {
webPlotterPage.sendPlotData(temperature, humidity, lightLevel);
Serial.print("T: ");
Serial.print(temperature);
Serial.print("°C, H: ");
Serial.print(humidity);
Serial.print("%, Light: ");
Serial.println(lightLevel);
}
}
모터 제어 피드백
void sendMotorData() {
int motorSpeed = analogRead(A0); // Speed potentiometer
int currentDraw = analogRead(A1); // Current sensor
int motorPosition = digitalRead(2); // Position sensor
float speedPercent = (motorSpeed / 1023.0) * 100;
float currentAmps = (currentDraw / 1023.0) * 5.0;
float positionDegrees = motorPosition * 90;
webPlotterPage.sendPlotData(speedPercent, currentAmps, positionDegrees);
}
PID 제어기 시각화
float setpoint = 50.0;
float kp = 1.0, ki = 0.1, kd = 0.01;
float integral = 0, previousError = 0;
void sendPIDData() {
float input = analogRead(A0) / 10.0;
float error = setpoint - input;
integral += error;
float derivative = error - previousError;
float output = (kp * error) + (ki * integral) + (kd * derivative);
previousError = error;
// Plot setpoint, input, error, and output
webPlotterPage.sendPlotData(setpoint, input, error, output);
}
성능 최적화
효율적인 데이터 전송
unsigned long lastPlotUpdate = 0;
const unsigned long PLOT_INTERVAL = 100; // Update every 100ms
void efficientDataSending() {
if (millis() - lastPlotUpdate >= PLOT_INTERVAL) {
lastPlotUpdate = millis();
// Only send data at defined intervals
float value1 = analogRead(A0) / 10.0;
float value2 = analogRead(A1) / 10.0;
webPlotterPage.sendPlotData(value1, value2);
}
}
조건부 데이터 전송
float lastSentValue = 0;
const float CHANGE_THRESHOLD = 5.0;
void sendOnChange() {
float currentValue = analogRead(A0) / 10.0;
// Only send if value changed significantly
if (abs(currentValue - lastSentValue) > CHANGE_THRESHOLD) {
webPlotterPage.sendPlotData(currentValue);
lastSentValue = currentValue;
}
}
프로젝트 아이디어
과학적 응용
- 데이터 로거: 시간에 따라 온도, 습도, 압력을 기록합니다
- 진동 분석: 기계 시스템용 가속도계 데이터를 모니터링합니다
- pH 모니터링: 아쿠아포닉스 시스템의 수질을 추적합니다
- 태양광 패널 효율성: 일조량에 따른 전압/전류 출력을 모니터링합니다
교육 프로젝트
- 물리 실험: 진자 운동 시각화, 스프링 진동
- 화학 실험실: 반응 속도 및 온도 변화 모니터링
- 생물학 연구: 식물 성장 센서 및 환경 요인 추적
- 수학: 수학적 함수 및 알고리즘 출력 그래프화
홈 자동화
- 에너지 모니터링: 전력 소비 패턴을 추적
- 정원 자동화: 토양 수분과 빛 수준 모니터링
- HVAC 제어: 온도 및 습도 추세를 시각화
- 보안 시스템: 모션 센서 활동을 시각화
로봇공학 및 제어
- 로봇 내비게이션: 위치 및 방향 데이터 시각화
- 모터 제어: 속도, 토크 및 효율성 모니터링
- 센서 융합: 여러 센서의 측정값 결합
- 경로 계획: 로봇의 움직임 알고리즘 시각화
문제 해결
자주 발생하는 문제
1. 그래프에 데이터가 표시되지 않음
- WiFi 연결 상태 확인
- 브라우저 콘솔에서 WebSocket 연결 확인
- sendPlotData()가 정기적으로 호출되고 있는지 확인
- 시리얼 모니터에서 오류 메시지 확인
2. 그래프가 점프하거나 불규칙하게 보임
- 데이터 필터링(이동 평균) 구현
- 데이터 전송 빈도 감소
- 센서 노이즈 또는 연결 문제 확인
- 전원 공급 안정성 확인
- 브라우저 성능 문제
- 최대 샘플 수를 줄이기 (setMaxSamples())
- 데이터 전송 속도를 낮추기
- 다른 브라우저 탭 닫기
- 브라우저에서 하드웨어 가속 사용하기
4. 웹소켓 연결이 끊김
- Wi-Fi 신호 강도 확인
- 라우터 설정 확인(방화벽, 포트 차단)
- 사용자 정의 코드에 재연결 로직 구현
- 아두이노 메모리 사용량 모니터링
디버깅 팁
상세 로깅 활성화
void debugPlotterData() {
Serial.println("=== Plotter Debug Info ===");
Serial.print("Free RAM: ");
Serial.println(freeMemory());
Serial.print("Connected clients: ");
Serial.println(server.getConnectedClients());
Serial.print("Data rate: ");
Serial.println("Every " + String(DATA_INTERVAL) + "ms");
Serial.println("========================");
}
테스트 데이터 생성
void generateTestPattern() {
static float phase = 0;
float sine = sin(phase) * 50 + 50;
float cosine = cos(phase) * 30 + 70;
float triangle = (phase / PI) * 25 + 25;
webPlotterPage.sendPlotData(sine, cosine, triangle);
phase += 0.1;
if (phase > 2 * PI) phase = 0;
}
고급 기능
사용자 정의 데이터 형식
void sendFormattedData() {
float temp = 25.5;
float humidity = 60.3;
// Create custom formatted data string
String dataLine = String(temp, 1) + "\t" + String(humidity, 1);
webPlotterPage.sendPlotData(dataLine);
}
다른 웹 앱과의 통합
void setupMultipleApps() {
// Add multiple web applications
server.addApp(new DIYablesHomePage());
server.addApp(new DIYablesWebDigitalPinsPage());
server.addApp(new DIYablesWebSliderPage());
server.addApp(&webPlotterPage);
server.addApp(new DIYablesNotFoundPage());
// Configure interactions between apps
webSliderPage.onSliderValueFromWeb([](int slider1, int slider2) {
// Use slider values to control what gets plotted
float scaleFactor = slider1 / 255.0;
// ... plotting logic
});
}
실시간 제어 및 그래프 그리기
void controlAndPlot() {
// Read control inputs
int targetSpeed = analogRead(A0);
// Control hardware
analogWrite(9, targetSpeed / 4); // PWM output
// Read feedback
int actualSpeed = analogRead(A1);
int motorCurrent = analogRead(A2);
// Plot target vs actual
webPlotterPage.sendPlotData(
targetSpeed / 4.0, // Target speed
actualSpeed / 4.0, // Actual speed
motorCurrent / 10.0 // Current draw
);
}
다음 단계
WebPlotter 예제를 숙달한 후, 다음을 탐색해 보세요:
- MultipleWebApps - 그래프 작성과 제어 인터페이스를 결합
- WebMonitor - 그래프 작성과 함께 디버깅 기능 추가
- Custom Applications - 직접 맞춤형 차트 도구를 구축하세요
- Data Analysis - 표시된 데이터에 대한 통계 분석을 구현
지원
추가 도움이 필요하신 경우:
- API 참조 문서를 확인하세요
- DIYables 튜토리얼 방문: https://newbiely.com/tutorials/arduino-uno-r4/arduino-uno-r4-diyables-webapps
- Arduino 커뮤니티 포럼
- 브라우저 개발자 도구의 WebSocket 디버깅 도구


