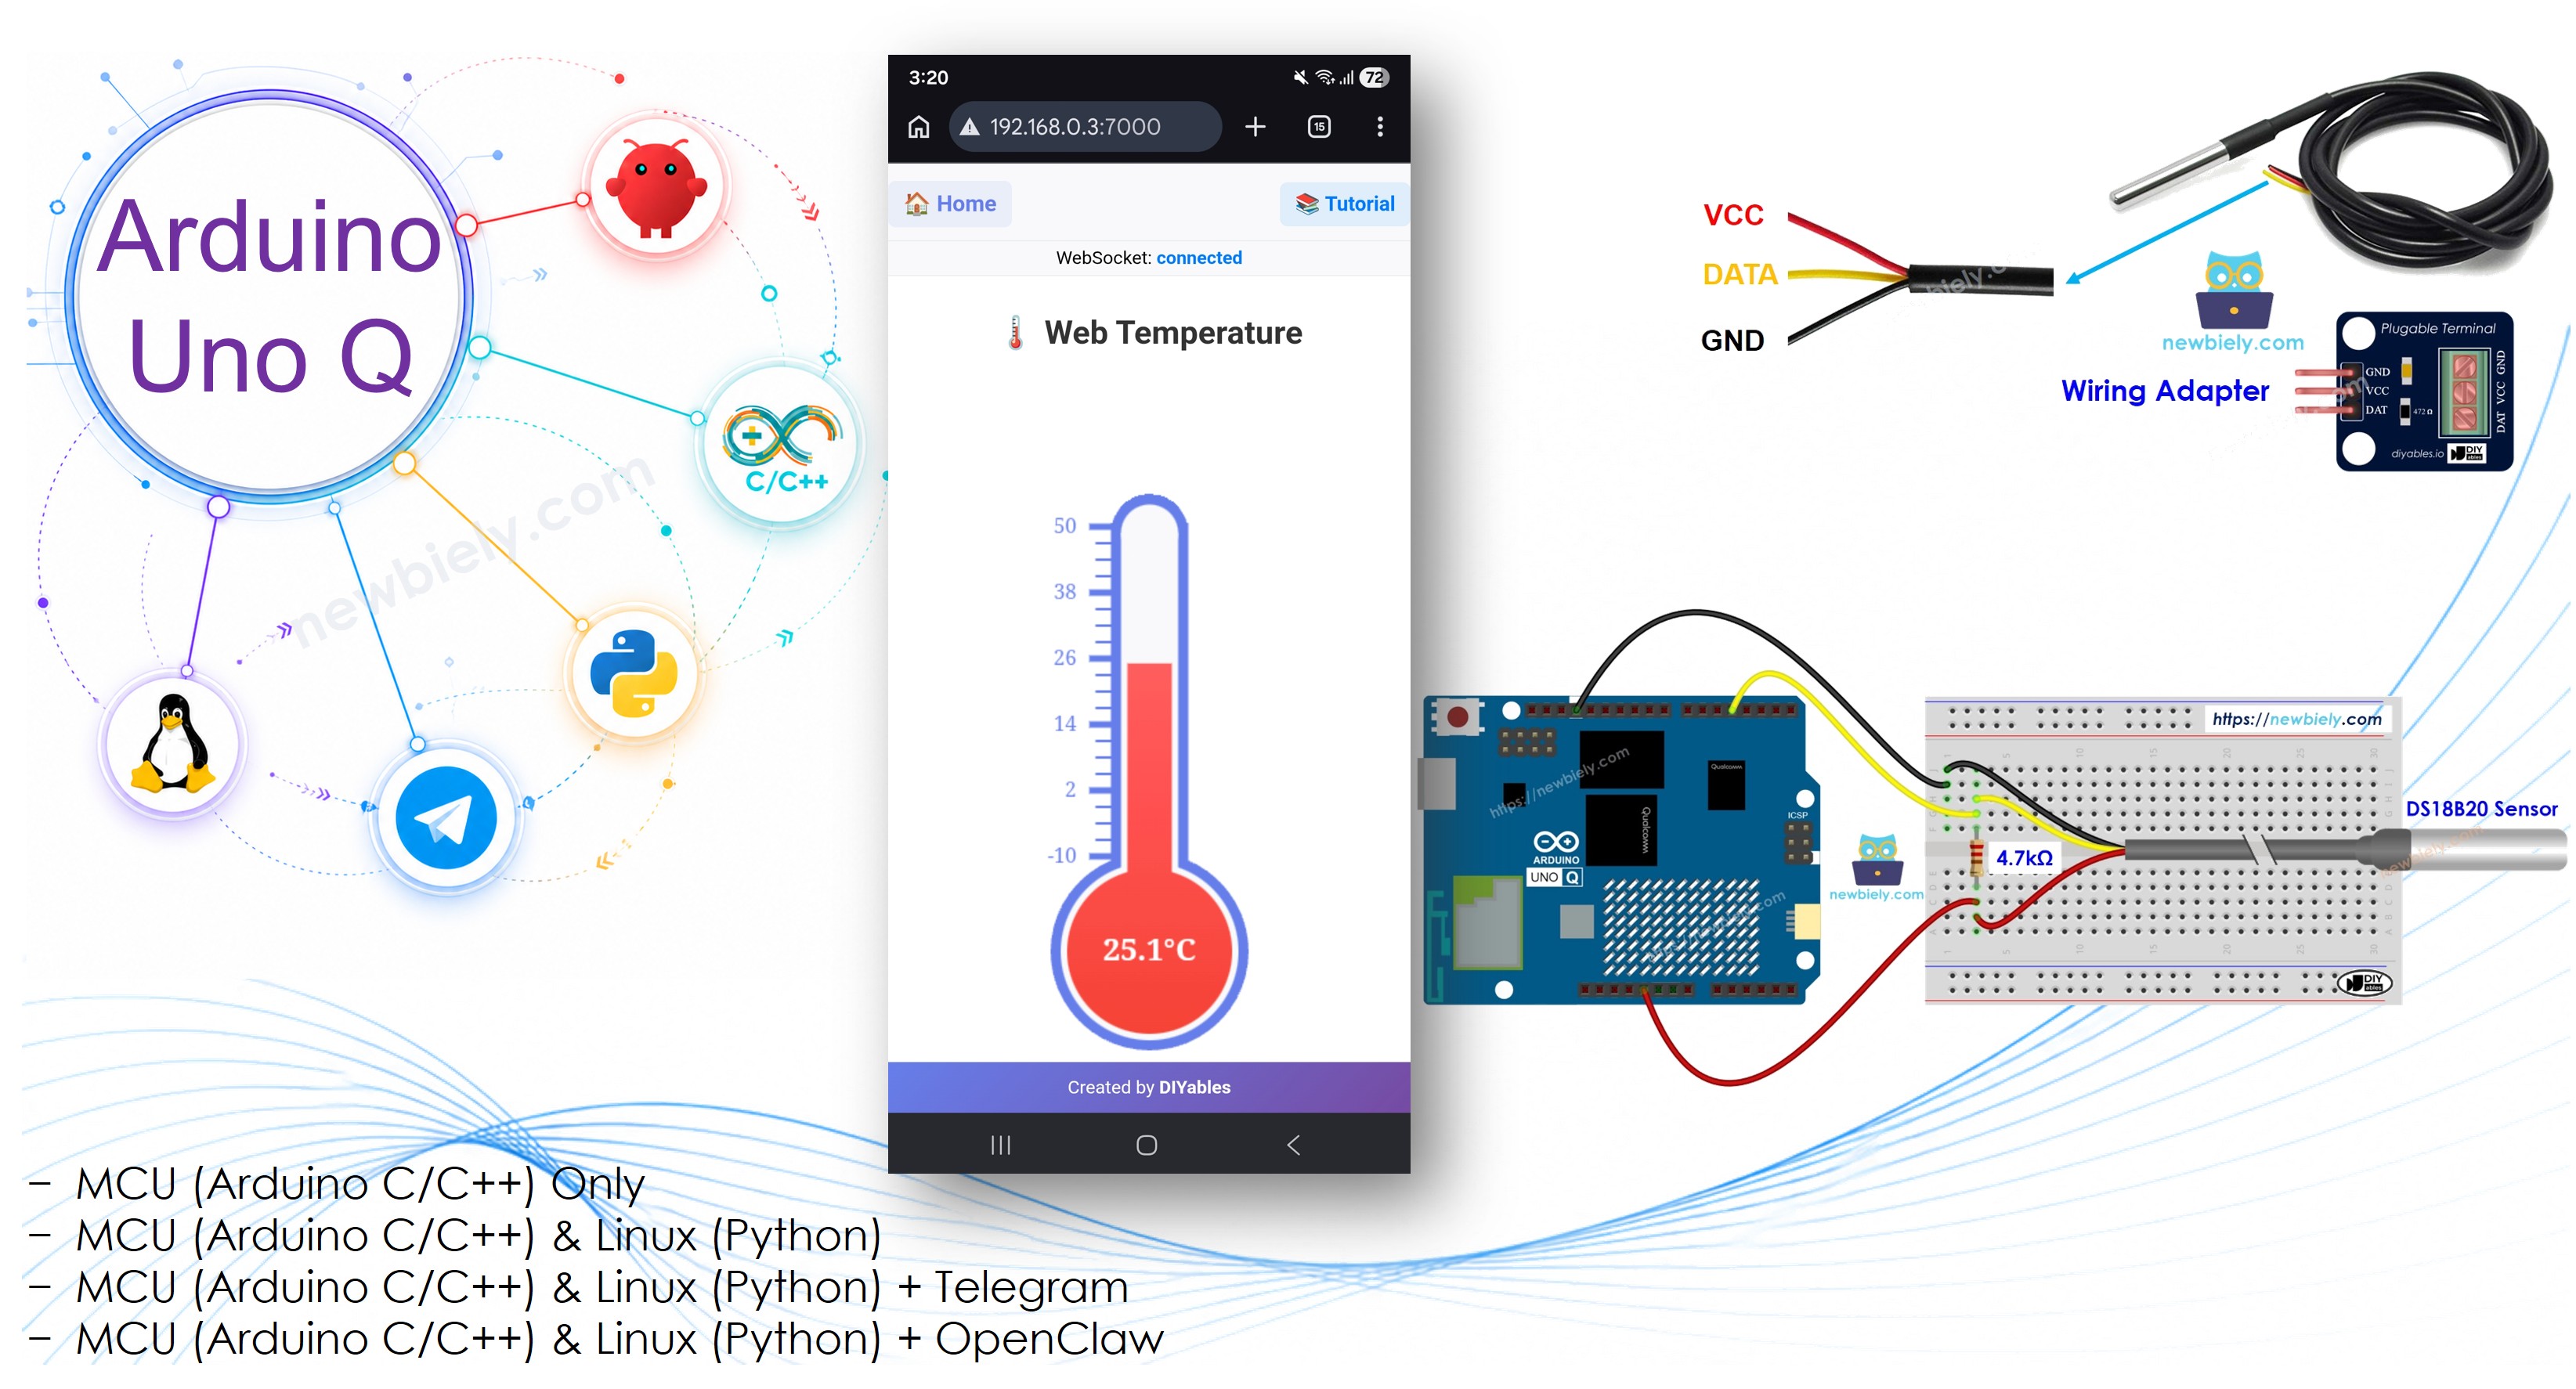
Arduino UNO Q는 WebSocket을 사용하여 실시간으로 모든 브라우저에 라이브 온도 데이터를 푸시할 수 있습니다 — 폴링 없음, 페이지 새로고침 없음. STM32 MCU는 매초 DS18B20 센서를 읽고 Bridge를 통해 값을 공유합니다. Qualcomm Linux MPU는 WebUI Brick의 내장 Socket.IO 서버를 사용하여 새 읽기가 도착하는 순간 모든 연결된 브라우저에 새 읽기를 브로드캐스트하는 Python 앱을 실행합니다. 추가 하드웨어나 클라우드 서비스가 필요하지 않습니다.
이 튜토리얼에서 다음을 배웁니다:
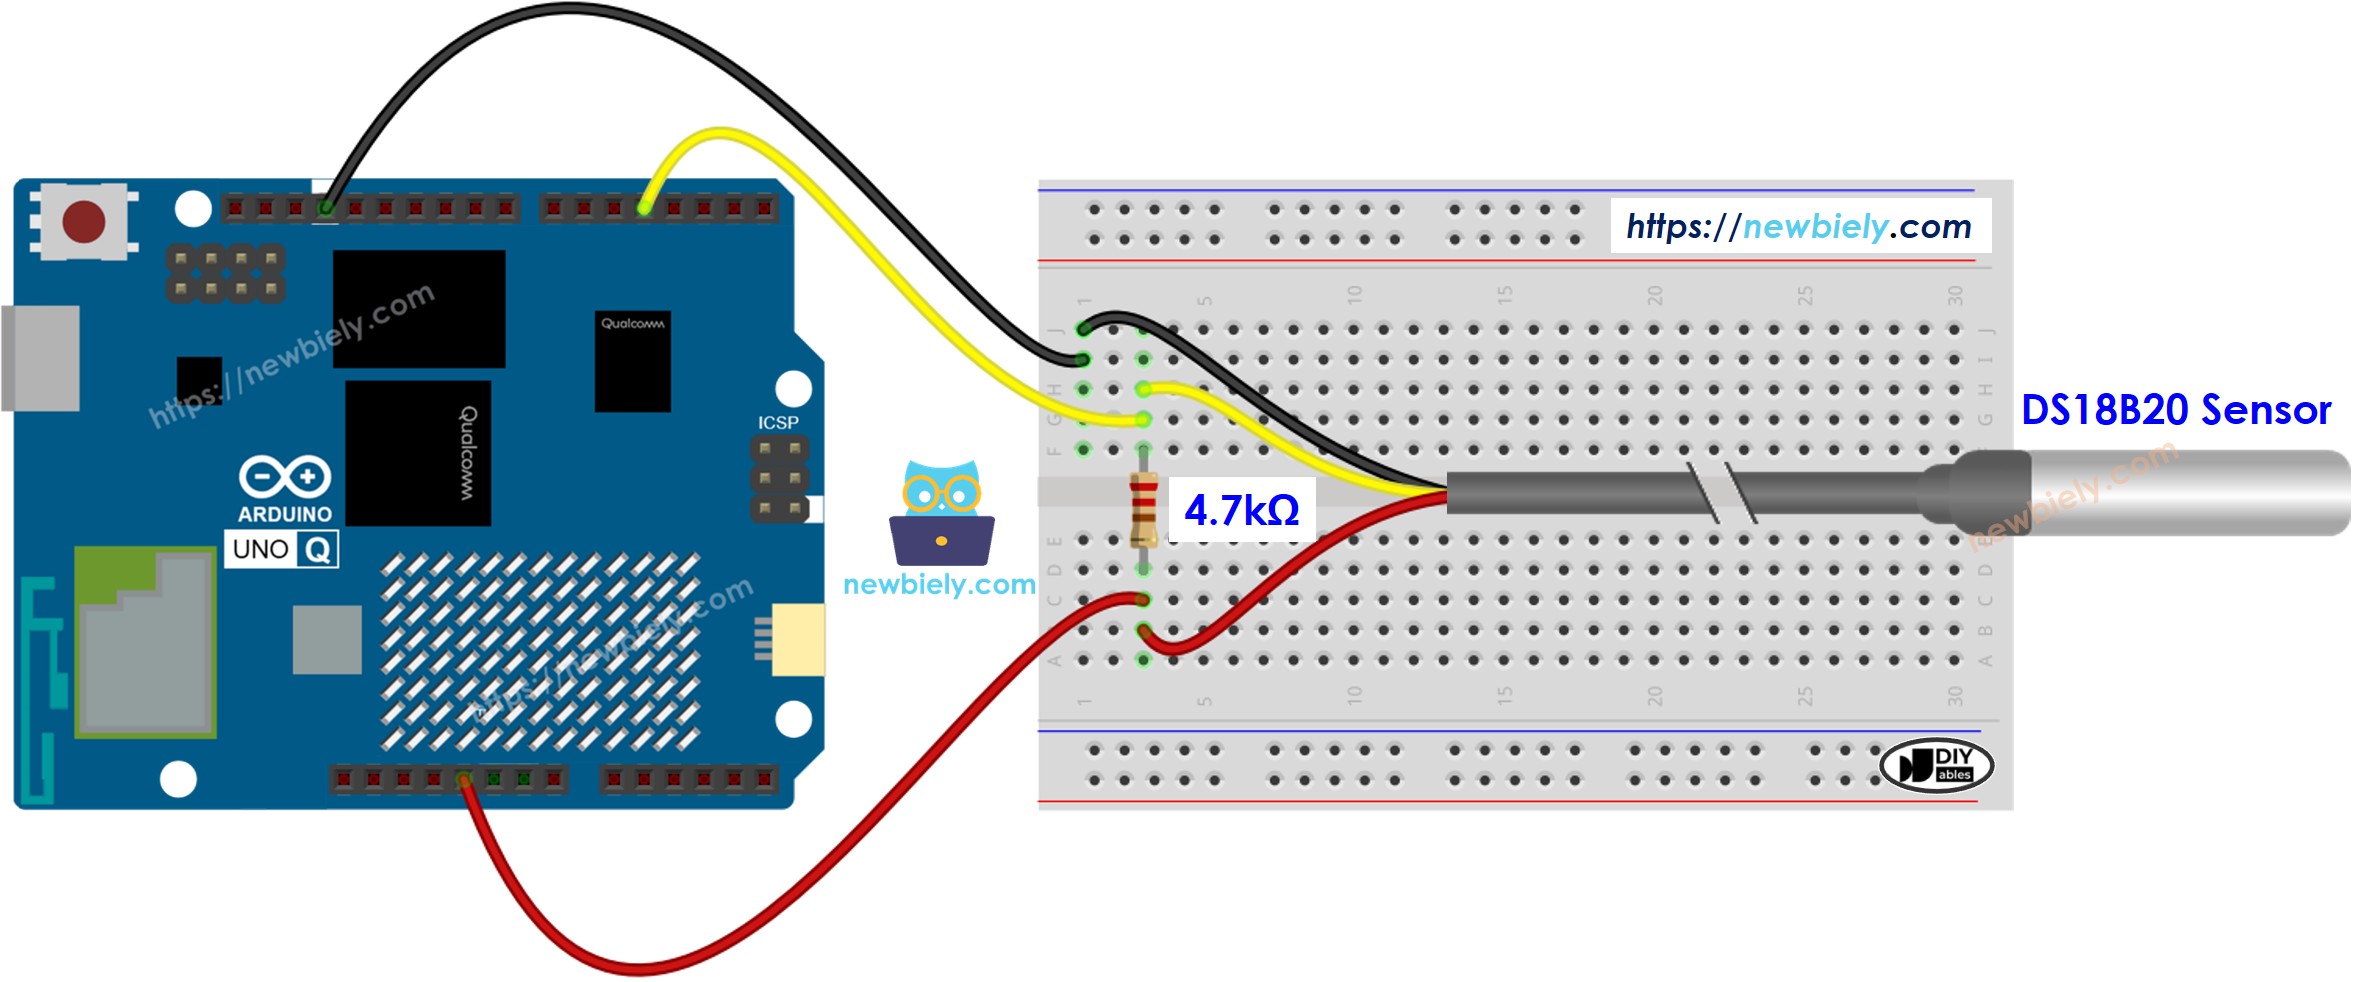
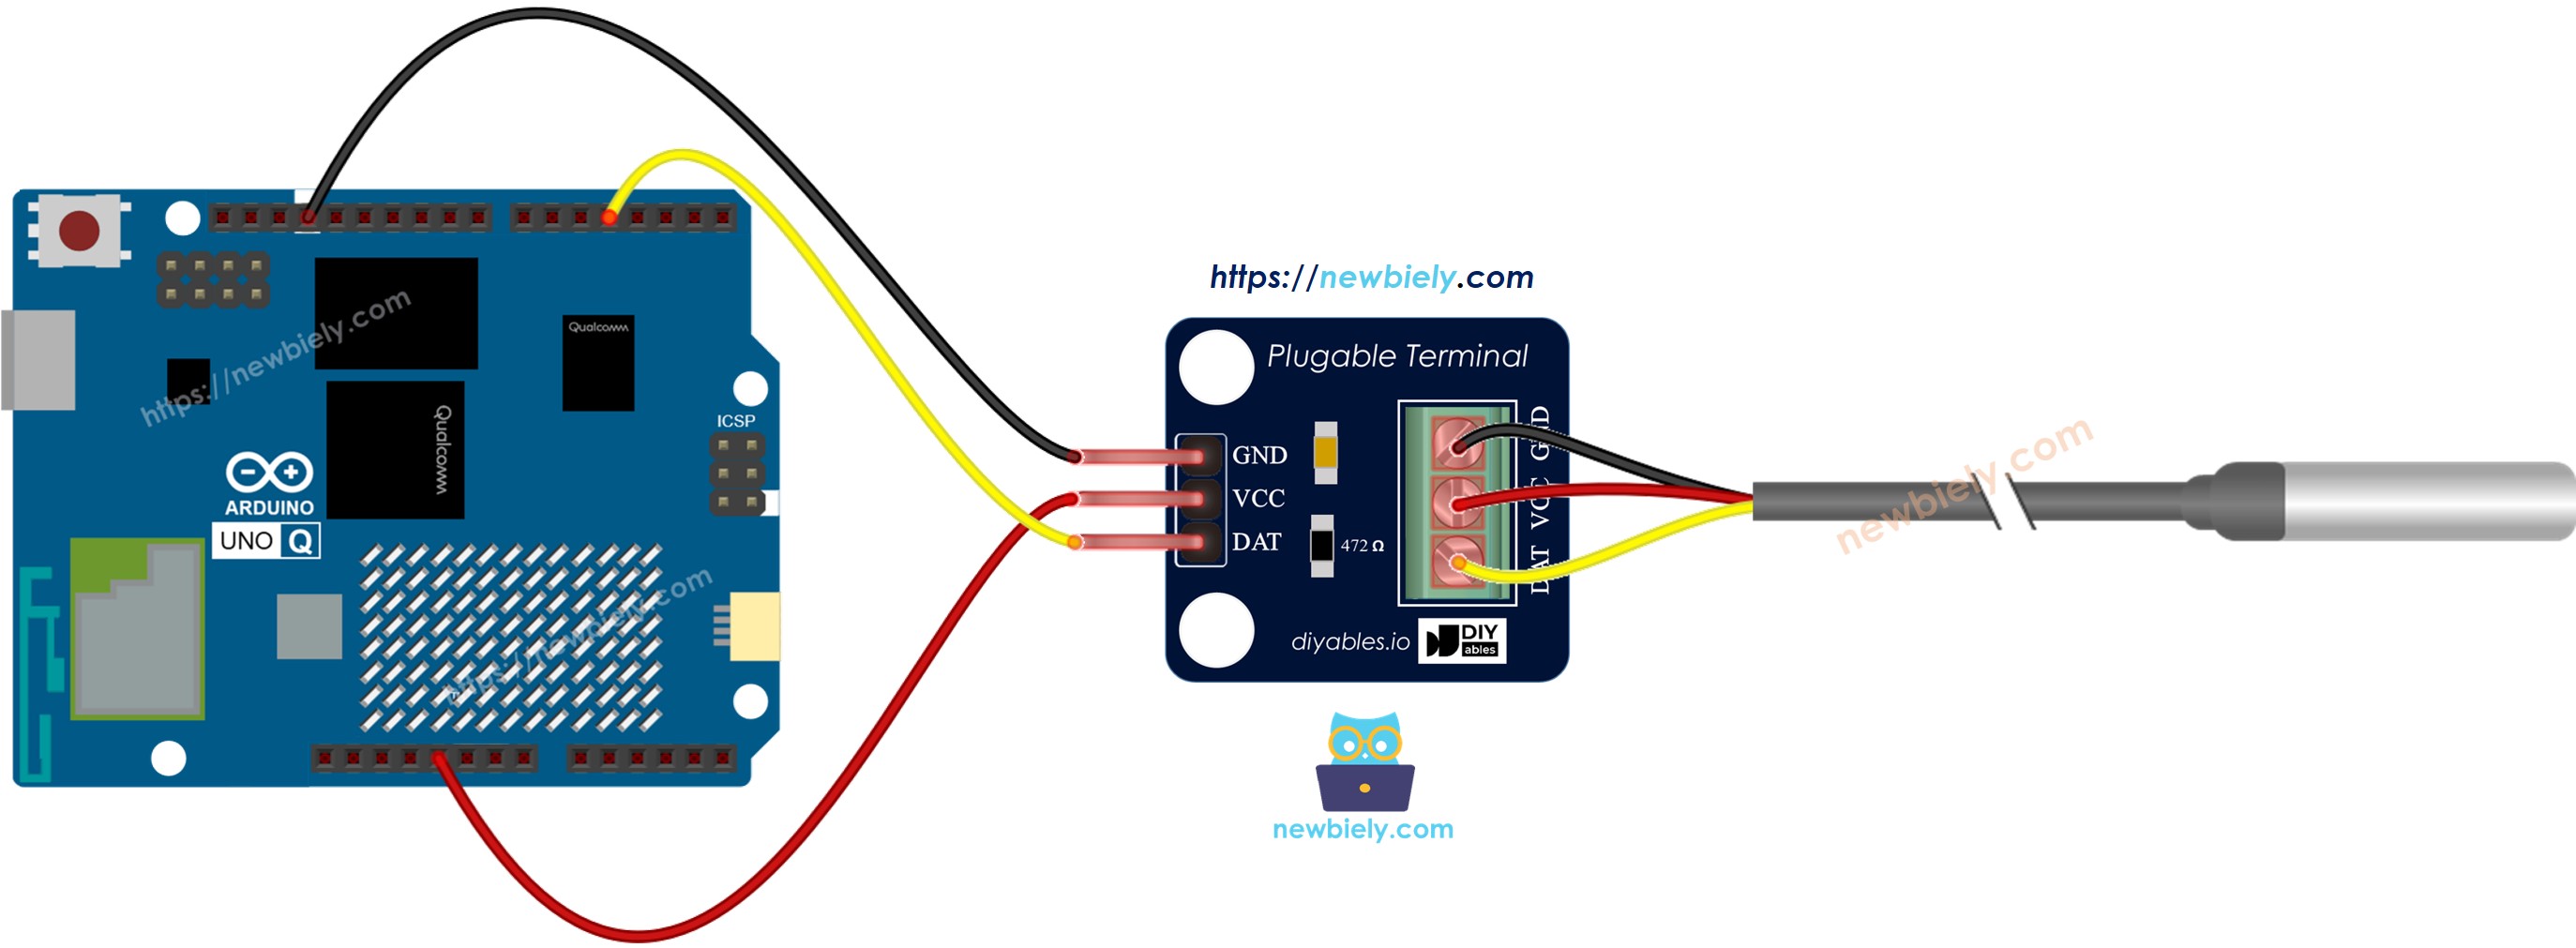
DS18B20 1-Wire 온도 센서를 Arduino UNO Q MCU에 연결하는 방법
Bridge를 통해 MCU에서 Linux MPU로 실시간 온도 데이터를 노출하는 방법
WebUI Brick을 사용하여 Arduino UNO Q Linux MPU에서 온도계 웹 페이지를 제공하는 방법
ui.on_message() 및 ui.send_message()를 사용하여 WebSocket을 통해 브라우저에 라이브 온도 업데이트를 푸시하는 방법
Socket.IO로 브라우저에서 WebSocket 메시지를 수신하고 새로고침 없이 캔버스 온도계를 업데이트하는 방법
공개: 이 포스팅 에 제공된 일부 링크는 아마존 제휴 링크입니다. 이 포스팅은 쿠팡 파트너스 활동의 일환으로, 이에 따른 일정액의 수수료를 제공받습니다.
DS18B20 및 웹 서버 정보
DS18B20 센서: 1-Wire 디지털 온도 센서 (−55 °C ~ +125 °C, ±0.5 °C 정확도). DATA와 VCC 사이의 4.7 kΩ 풀업 저항이 필요합니다 — 어댑터가 있는 센서는 포함되어 있습니다. 배선 및 라이브러리 세부 사항은 아두이노 우노 Q - 온도 센서을 참조하세요.
WebUI Brick: WebUI - HTML Brick은 포트 7000에서 HTML 파일을 제공하고 Socket.IO WebSocket 연결을 처리하는 웹 서버를 실행합니다. Python 코드는 ui.on_message()를 사용하여 브라우저에서 이벤트를 수신하고 ui.send_message()를 사용하여 데이터를 다시 푸시합니다. 동일한 Wi-Fi의 모든 디바이스는 http://<board-ip>:7000/에서 페이지에 액세스할 수 있습니다.
실시간 흐름: 브라우저는 Socket.IO를 통해 연결하고 온도 구성 및 첫 번째 읽기를 요청합니다. Python 백그라운드 스레드는 Bridge를 통해 매초 센서를 읽고 각 업데이트를 모든 연결된 브라우저에 브로드캐스트합니다. 캔버스 온도계는 모든 푸시에서 다시 그려집니다 — 폴링 없음, 새로고침 없음.
WebSocket을 처음 사용하나요? Arduino UNO Q에서 Socket.IO를 사용한 적이 없다면 아두이노 우노 Q - WebSocket 튜토리얼부터 시작하세요 — 센서가 필요 없는 간단한 LED 제어 예제를 사용하여 동일한 패턴을 가르칩니다.
STM32 MCU는 매초 DS18B20 센서를 읽고 get_temperature라는 Bridge 함수를 통해 값을 노출합니다.
Qualcomm MPU는 WebUI Brick을 사용하여 포트 7000에서 온도계 페이지를 제공하고 WebSocket을 통해 모든 브라우저에 라이브 온도 업데이트를 푸시하는 Python 앱을 실행합니다.
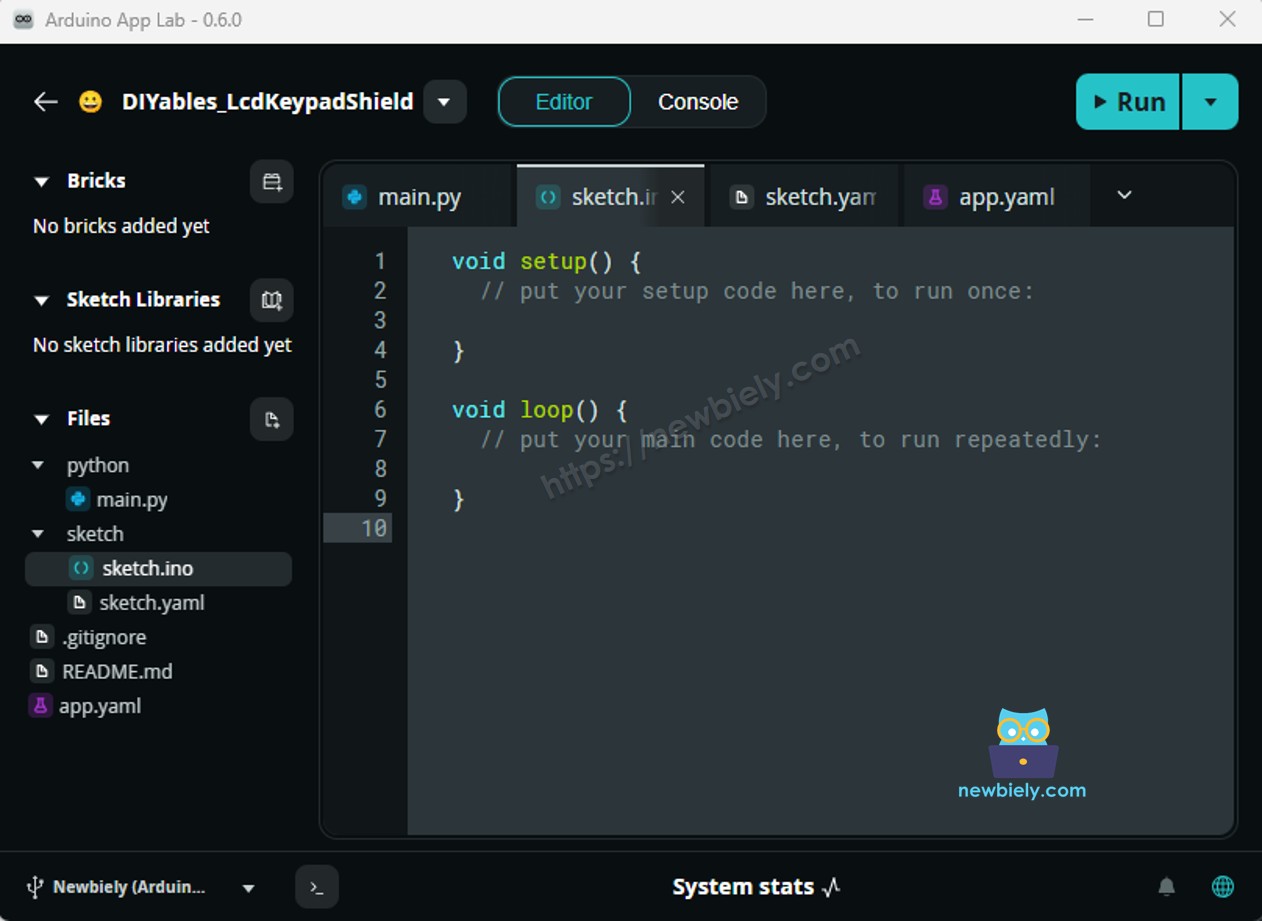
MCU 코드
/* * 이 Arduino UNO Q 코드는 newbiely.kr 에서 개발되었습니다 * 이 Arduino UNO Q 코드는 어떠한 제한 없이 공개 사용을 위해 제공됩니다. * 상세한 지침 및 연결도에 대해서는 다음을 방문하세요: * https://newbiely.kr/tutorials/arduino-uno-q/arduino-uno-q-real-time-temperature-monitor-on-web-browser */#include <OneWire.h>#include <DallasTemperature.h>#include"Arduino_RouterBridge.h"#define SENSOR_PIN 4OneWire oneWire(SENSOR_PIN);DallasTemperature DS18B20(&oneWire);float last_temp_c = 0.0;unsignedlong last_read_ms = 0;constunsignedlong READ_INTERVAL = 1000;void update_temperature() { DS18B20.requestTemperatures();float t = DS18B20.getTempCByIndex(0);if (t != DEVICE_DISCONNECTED_C) { last_temp_c = t; }}String get_temperature(String arg) {returnString(last_temp_c, 2);}voidsetup() {Bridge.begin(); Monitor.begin(); DS18B20.begin(); update_temperature();Bridge.provide("get_temperature", get_temperature); Monitor.println("DS18B20 initialized on pin D4"); Monitor.println("Bridge ready");}voidloop() {unsignedlongnow = millis();if (now - last_read_ms >= READ_INTERVAL) { last_read_ms = now; update_temperature(); }}
Python 코드
/* * 이 Arduino UNO Q 코드는 newbiely.kr 에서 개발되었습니다 * 이 Arduino UNO Q 코드는 어떠한 제한 없이 공개 사용을 위해 제공됩니다. * 상세한 지침 및 연결도에 대해서는 다음을 방문하세요: * https://newbiely.kr/tutorials/arduino-uno-q/arduino-uno-q-real-time-temperature-monitor-on-web-browser */import threadingimport timefrom arduino.app_utils import *from arduino.app_bricks.web_ui import WebUIMIN_TEMP = -10MAX_TEMP = 50UNIT = "°C"def read_temperature():try: raw = Bridge.call("get_temperature", "")returnround(float(raw), 2)exceptException:return 0.0def on_get_config(client, data): config = {"minValue": MIN_TEMP, "maxValue": MAX_TEMP, "unit": UNIT} ui.send_message("temperature_config", config, client)def on_subscribe(client, data): ui.send_message("temperature_update", {"value": read_temperature()}, client)def push_temperature():whileTrue:try: ui.send_message("temperature_update", {"value": read_temperature()})exceptException:pass time.sleep(1)ui = WebUI()ui.on_message("get_config", on_get_config)ui.on_message("subscribe", on_subscribe)threading.Thread(target=push_temperature, daemon=True).start()App.run()
HTML (assets/index.html)
이 파일을 App의 assets/ 폴더에 배치합니다. assets/libs/socket.io.min.js에서 Socket.IO 클라이언트를 로드하고 서버 푸시마다 다시 그려지는 라이브 캔버스 온도계를 그립니다:
Install the library: Click the Add sketch library button (the open book icon with a + sign) in the left sidebar.
Search for DallasTemperature created by Miles Burton , Tim Newsome , Guil Barros , Rob Tillaart and click the Install button.
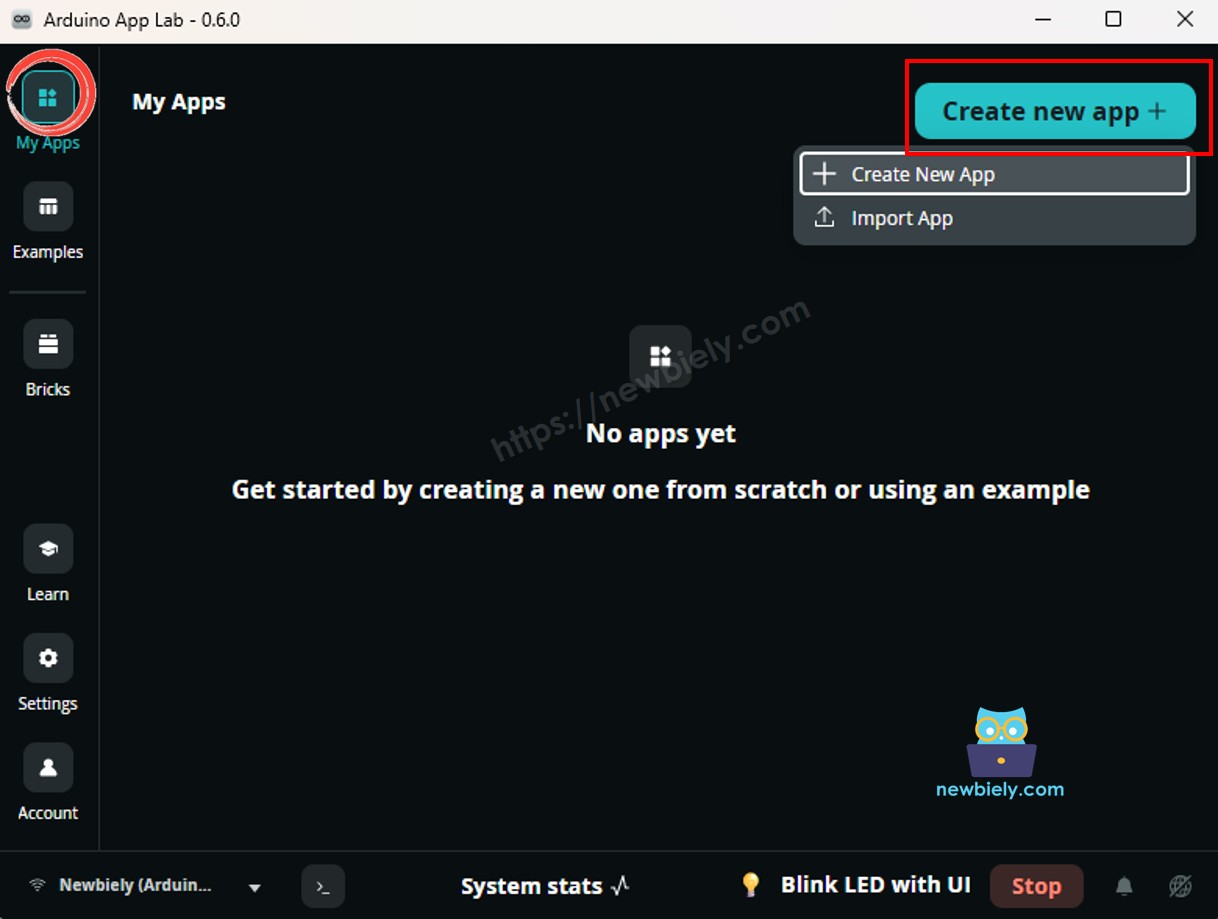
My Apps/DIYables Apps
Run
Bricks
No bricks added...
Sketch Libraries
No sketch libra...
Files
python
sketch
.gitignore
README.md
app.yaml
sketch.ino
Add sketch library
DallasTemperature
DallasTemperatureMiles Burton , Tim Newsome , Guil Barros , Rob Tillaart
Supports DS18B20, DS18S20, DS1822, DS1820
3.9.0
Install
More Info
Search for OneWire created by Jim Studt, Tom Pollard, Robin James, Glenn Trewitt, Jason Dangel, Guillermo Lovato, Paul Stoffregen, Scott Roberts, Bertrik Sikken, Mark Tillotson, Ken Butcher, Roger Clark, Love Nystrom and click the Install button.
My Apps/DIYables Apps
Run
Bricks
No bricks added...
Sketch Libraries
No sketch libra...
Files
python
sketch
.gitignore
README.md
app.yaml
sketch.ino
Add sketch library
OneWire
OneWireJim Studt, Tom Pollard, Robin James, Glenn Trewitt, Jason Dangel, Guillermo Lovato, Paul Stoffregen, Scott Roberts, Bertrik Sikken, Mark Tillotson, Ken Butcher, Roger Clark, Love Nystrom
2.3.8
Install
More Info
Search for Arduino_RouterBridge created by Arduino and click the Install button.
My Apps/DIYables Apps
Run
Bricks
No bricks added...
Sketch Libraries
No sketch libra...
Files
python
sketch
.gitignore
README.md
app.yaml
sketch.ino
Add sketch library
Arduino_RouterBridge
Arduino_RouterBridgeArduino
This library provides a simple RPC bridge for Arduino UNO Q boards, allowing communication between the board and other devices using MsgPack serialization.
0.4.1
Install
More Info
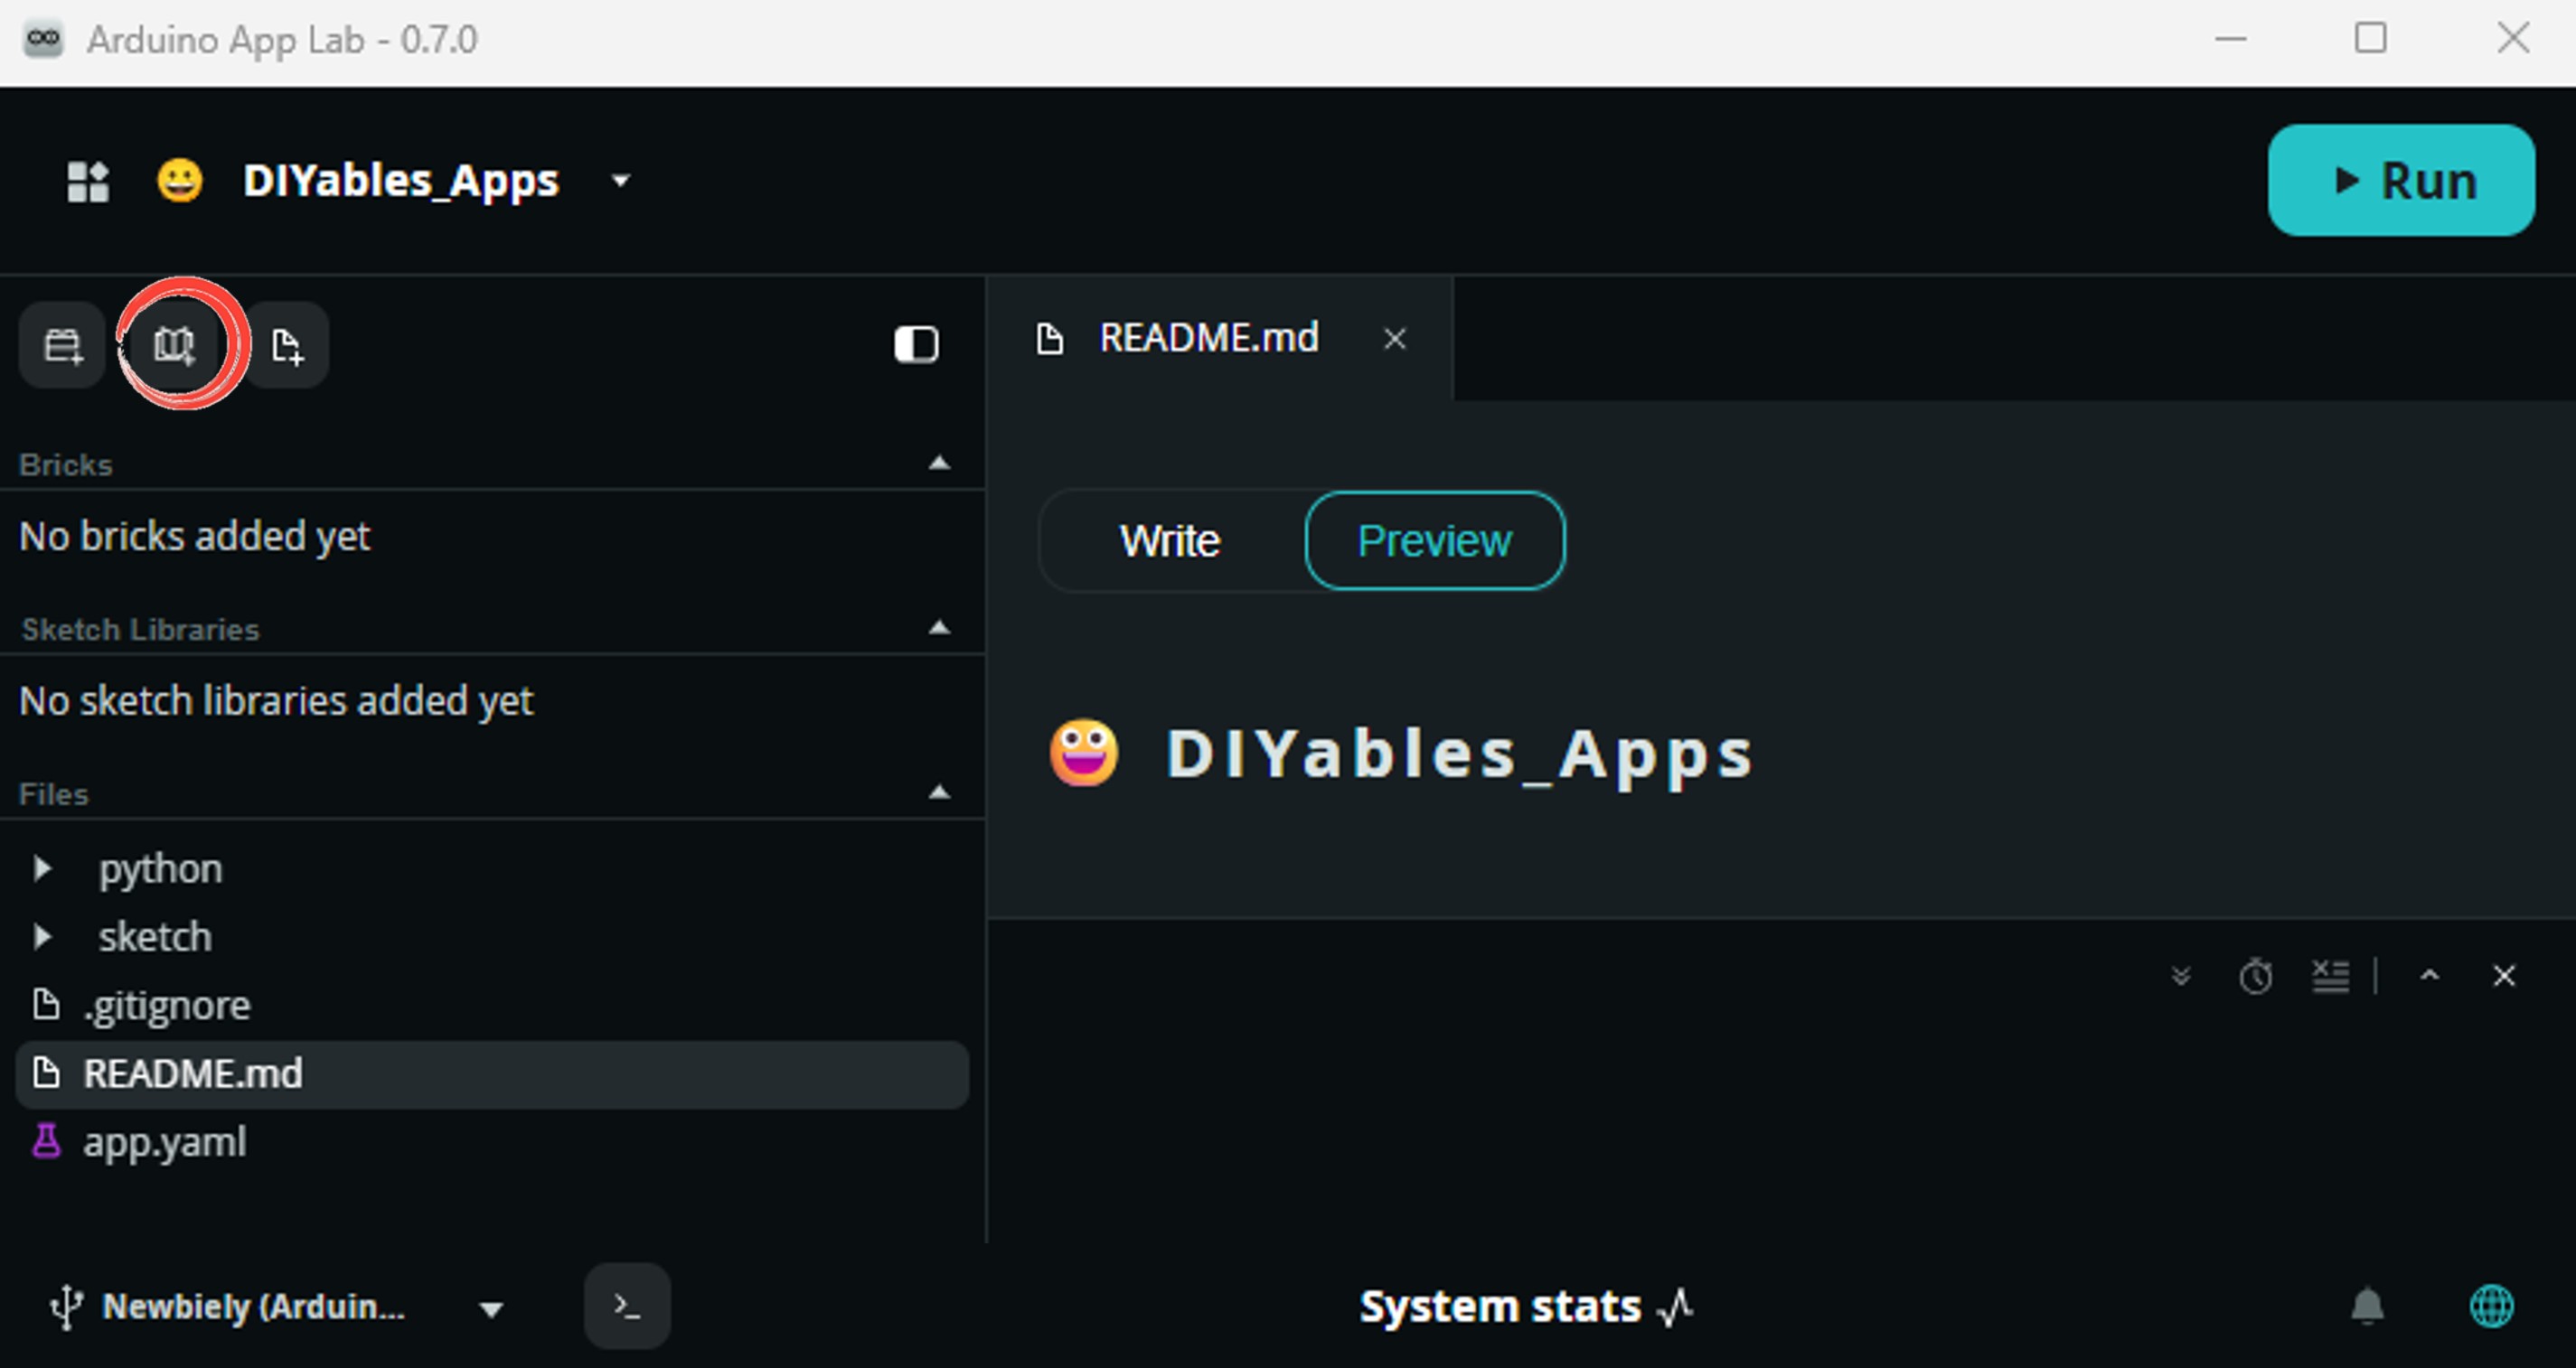
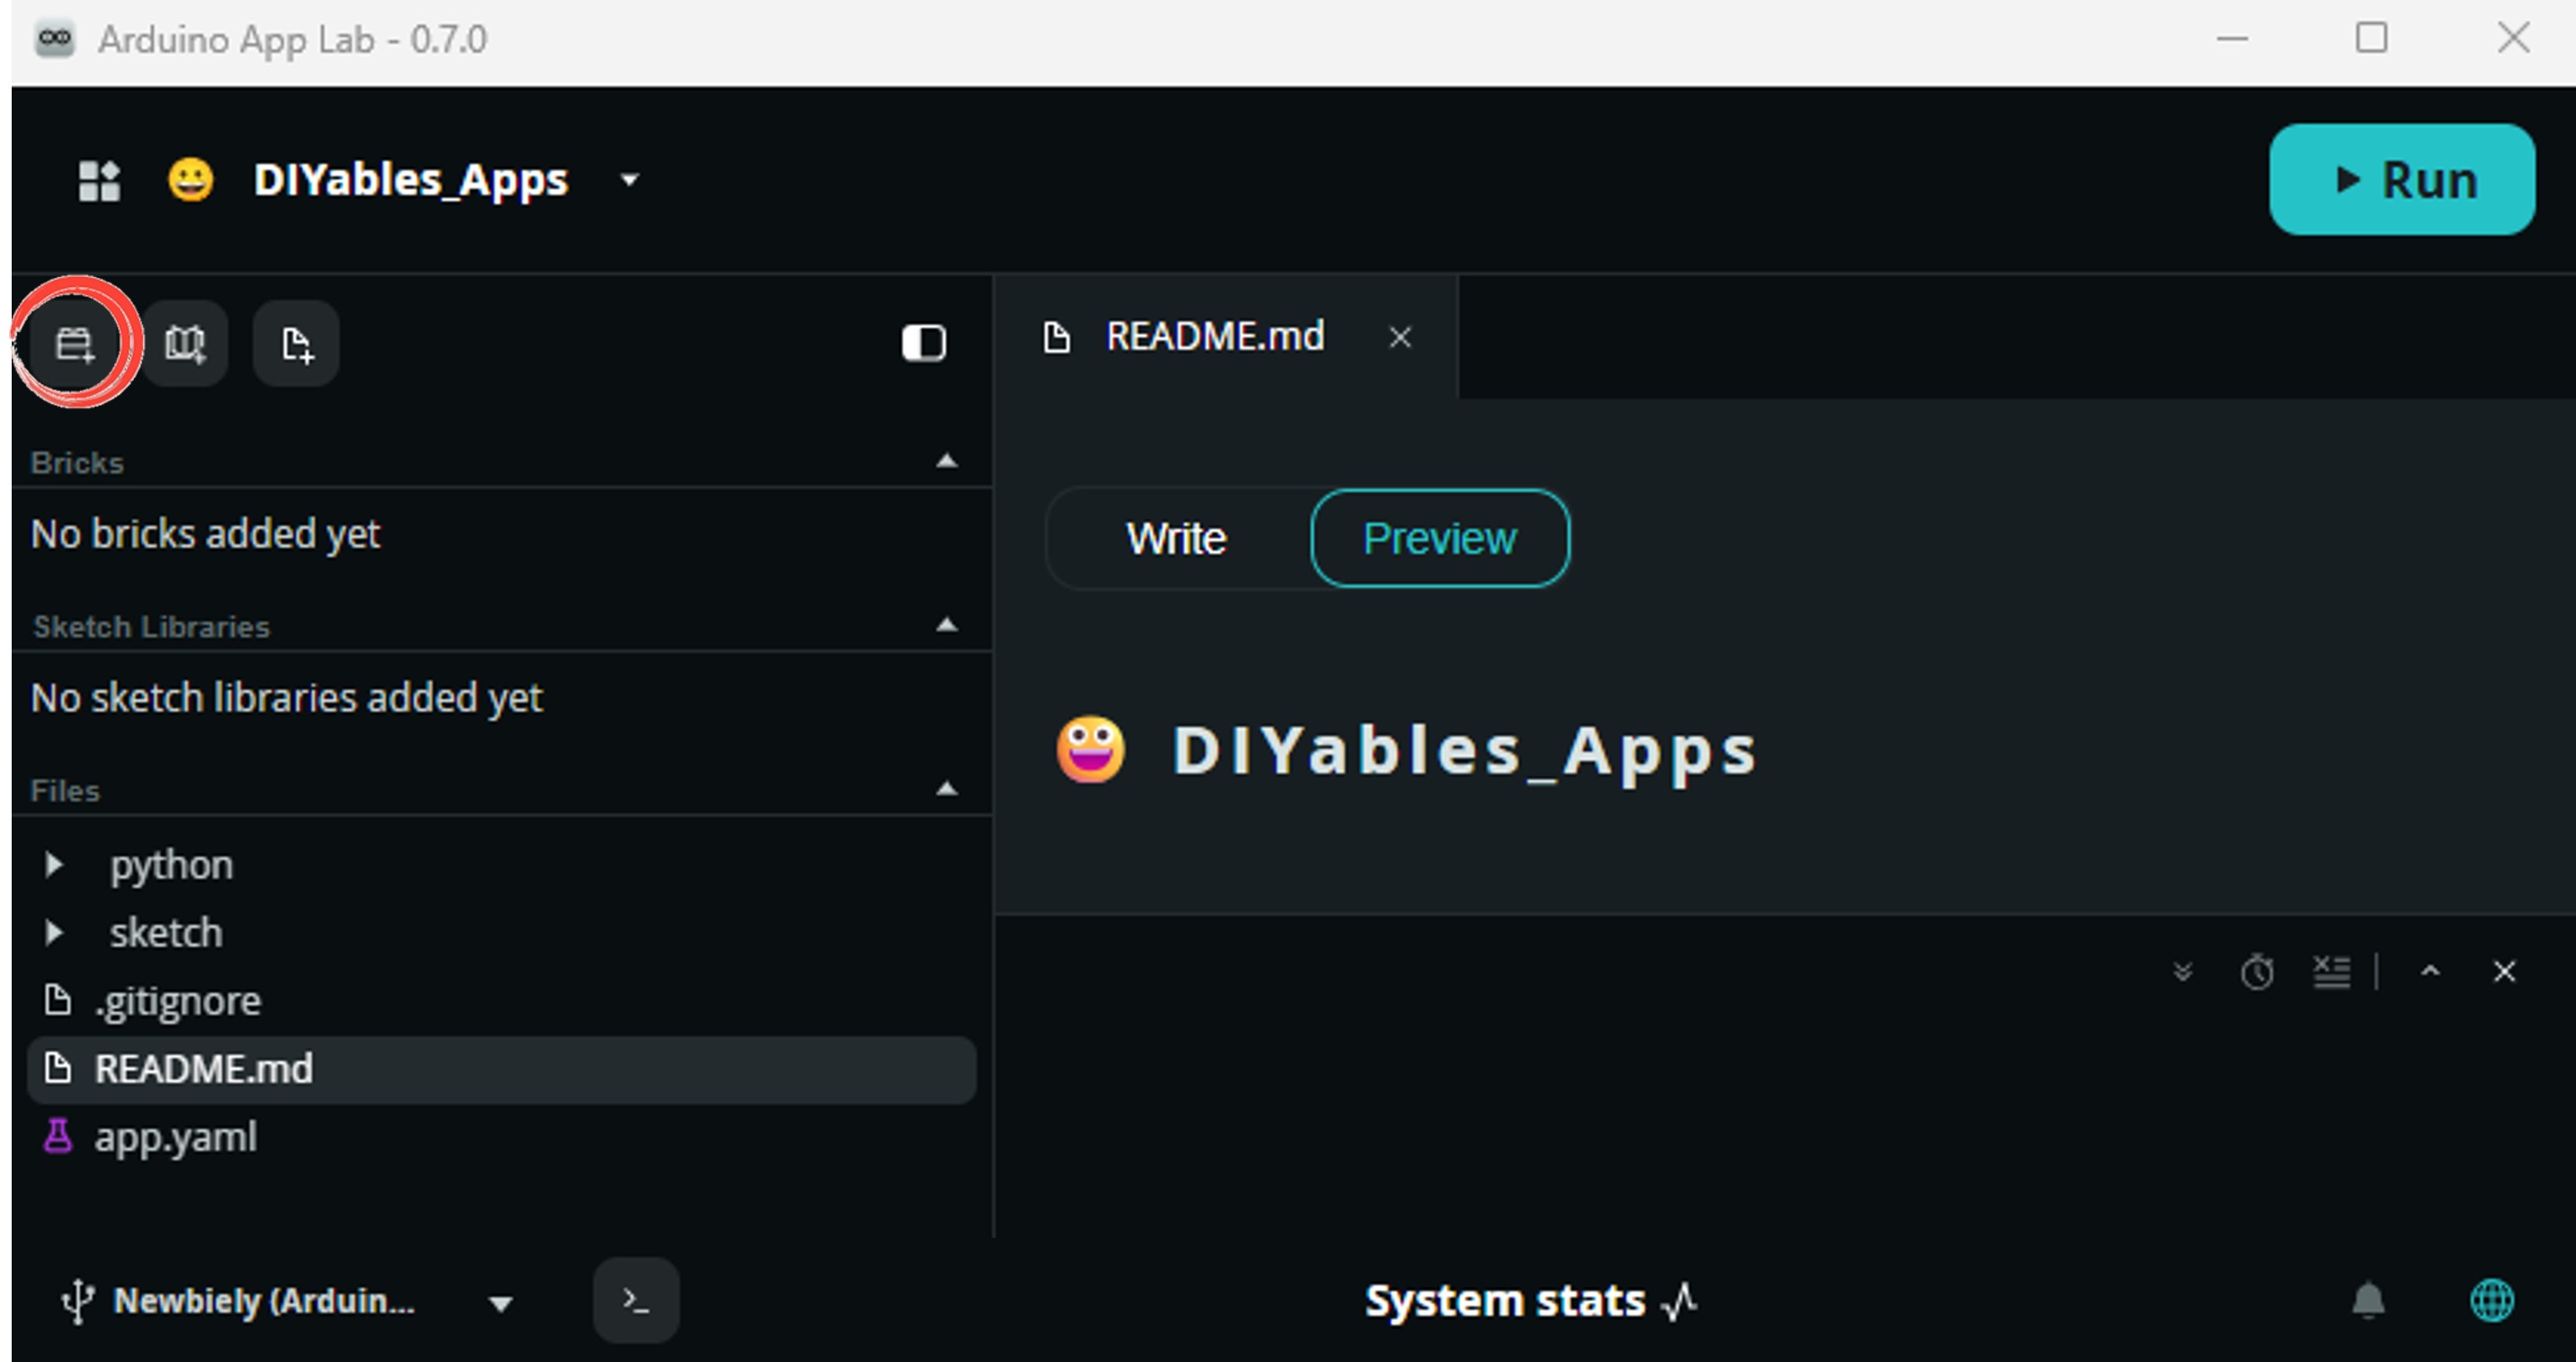
WebUI Brick 추가: Editor 사이드바의 Brick 추가 버튼을 클릭하여 Bricks 카탈로그를 엽니다.
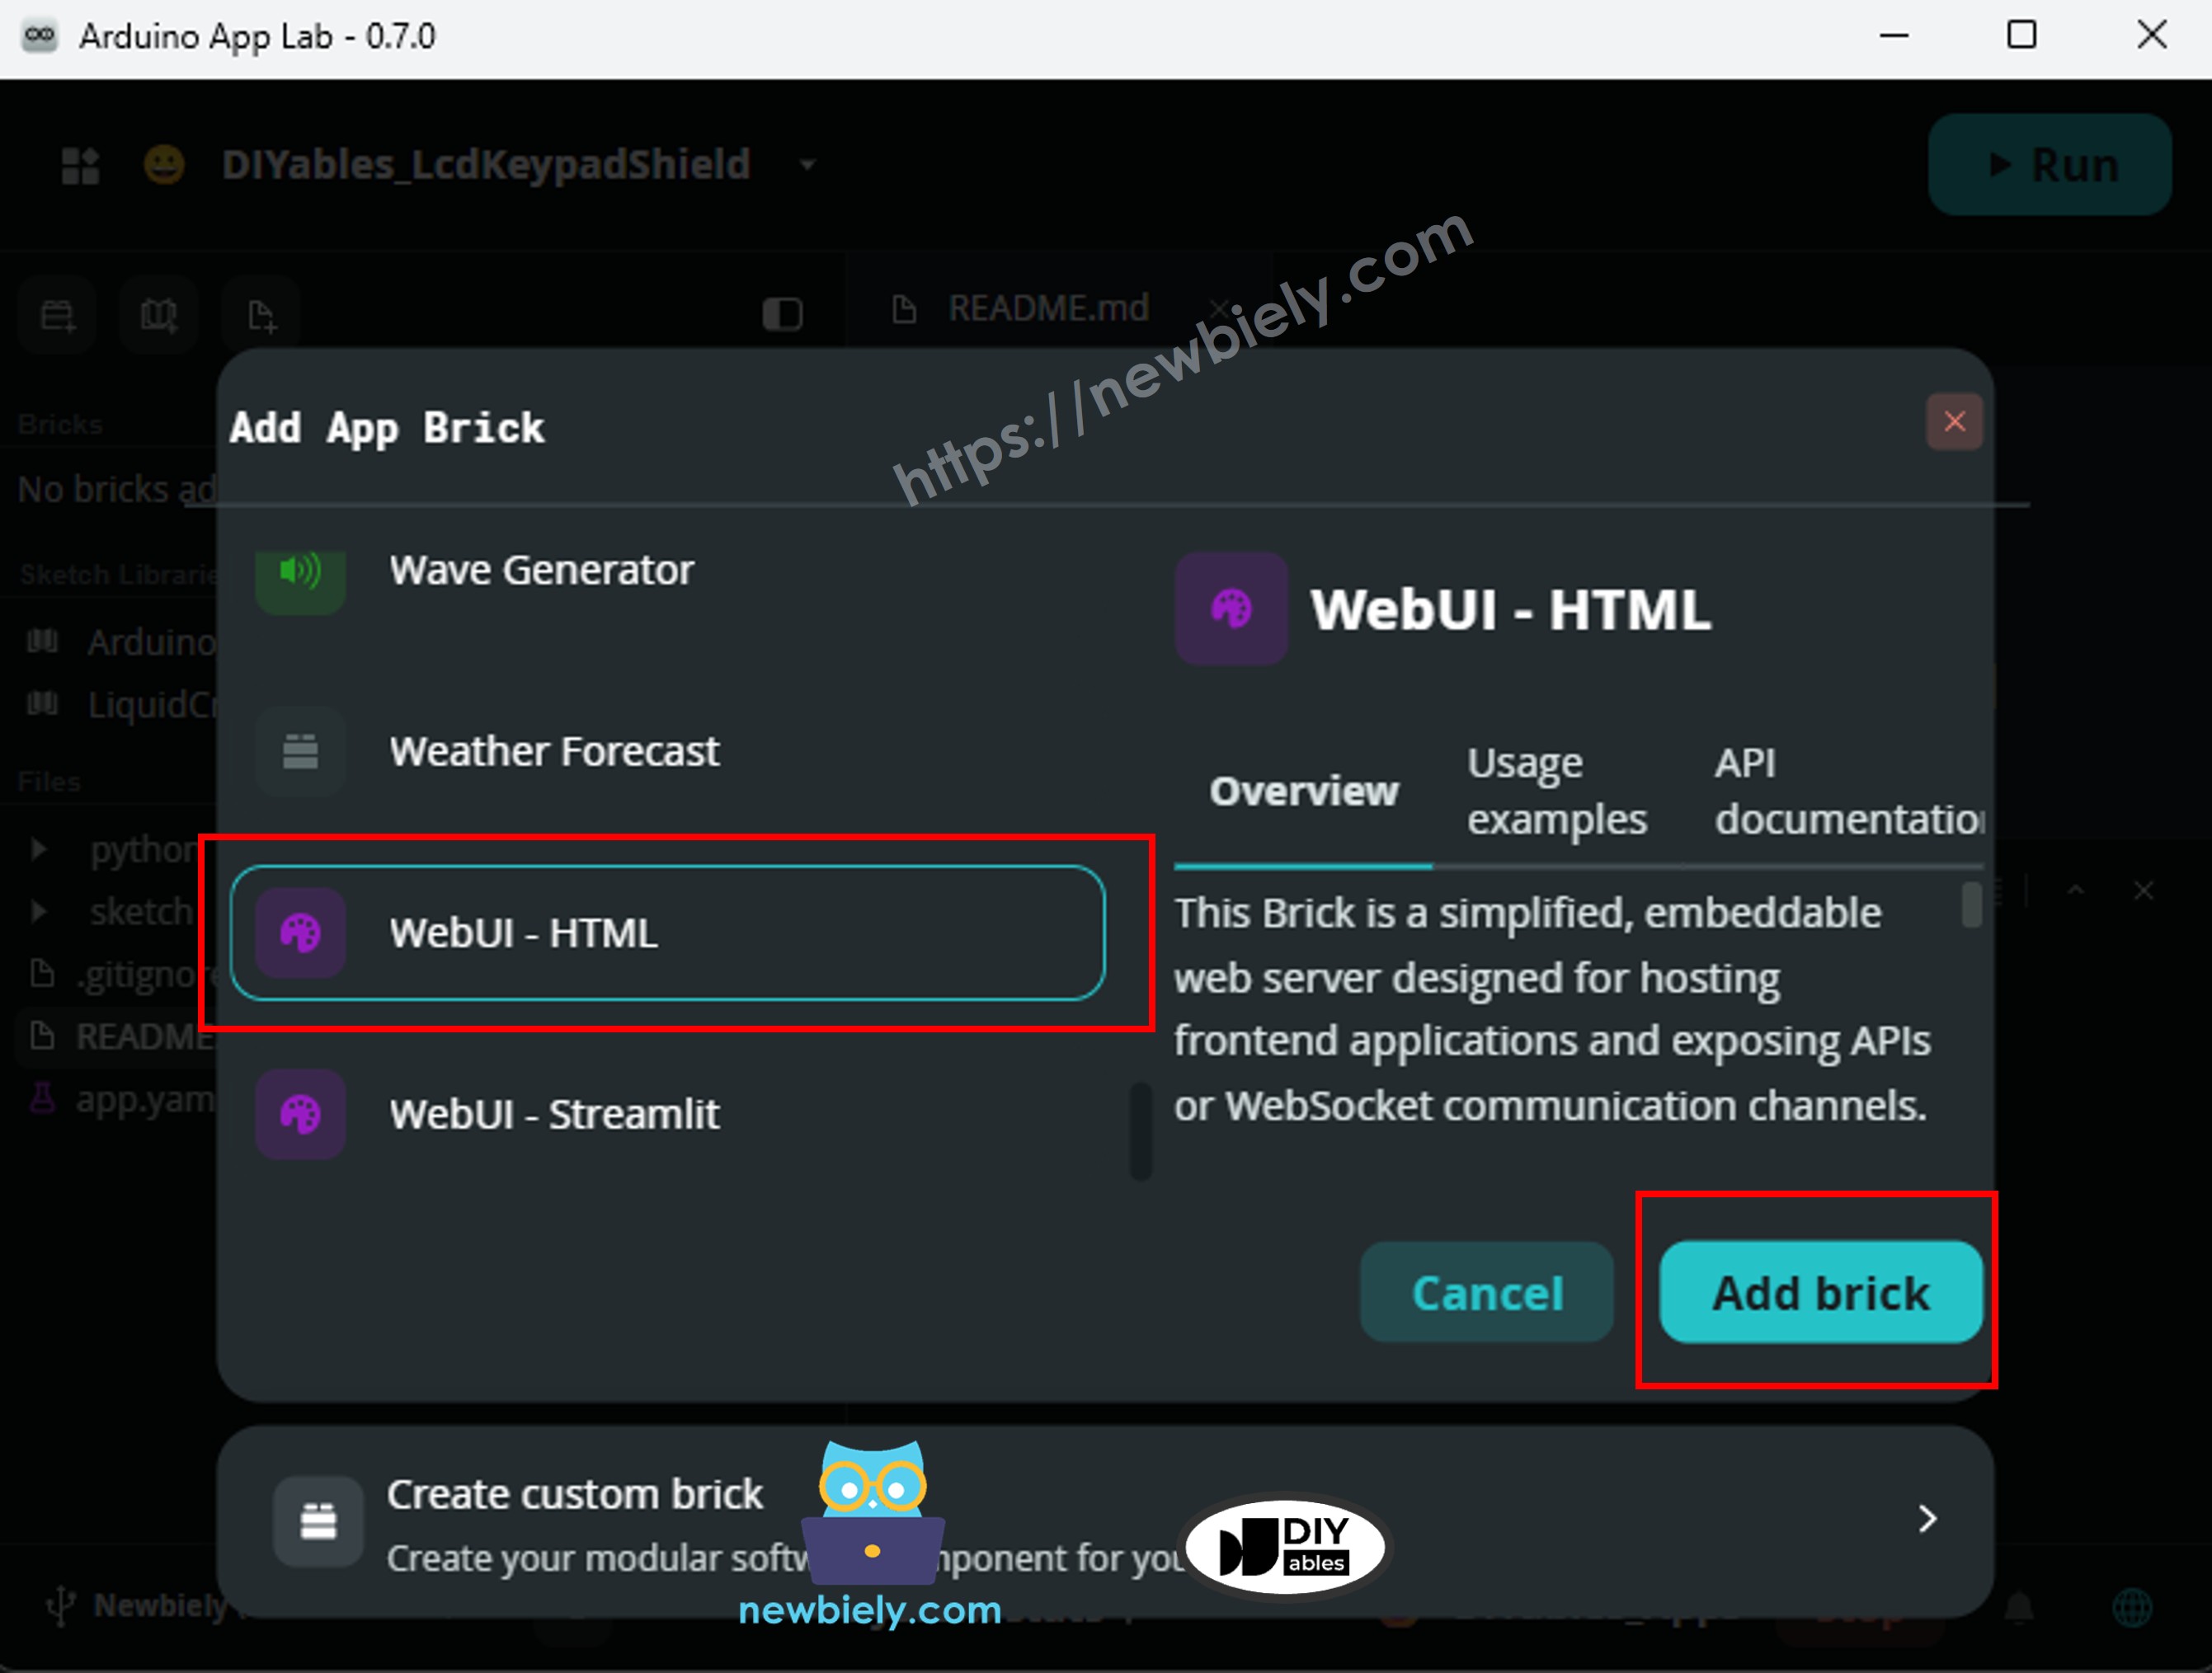
목록에서 WebUI - HTML을 찾아 선택한 다음 모든 구성 프롬프트를 따릅니다.
Arduino App Lab은 자동으로 app.yaml 파일에 Brick 항목을 추가합니다 — 해당 항목을 수동으로 편집하지 마세요.
※ 주의:
WebUI - HTML Brick은 HTTP 파일 제공과 Socket.IO WebSocket을 포트 7000의 단일 서비스에서 처리합니다. Socket.IO 클라이언트 스크립트는 assets/libs/socket.io.min.js에 배치되어야 합니다 — brick은 호환되는 버전을 자동으로 제공하지 않습니다. Bricks 정보를 참조하세요.
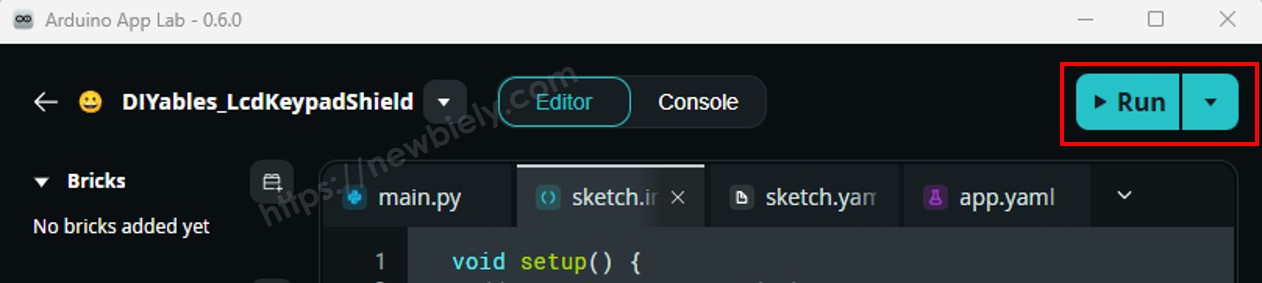
업로드: Arduino App Lab에서 실행 버튼을 클릭하여 컴파일하고 업로드합니다.
휴대폰이나 PC의 웹 브라우저를 열고 다음으로 이동합니다:
http://<ARDUINO_UNO_Q_IP>:7000/
<ARDUINO_UNO_Q_IP>를 Python 콘솔에 표시된 IP 주소로 바꿉니다.
App Lab 콘솔 출력
DIYables_Apps
Stop
sketch.ino
1#include"Arduino_RouterBridge.h"
Serial Monitor
Python
Message (Enter to send a message to "Newbiely" on usb(2820070321))
2026-05-08 09:00:02.000 INFO - [WebUI.execute] WebUI: The application interface is available here:
- Local URL: http://localhost:7000
- Network URL: http://192.168.0.45:7000
2026-05-08 09:00:02.001 INFO - [MainThread] App: App started
브라우저 출력
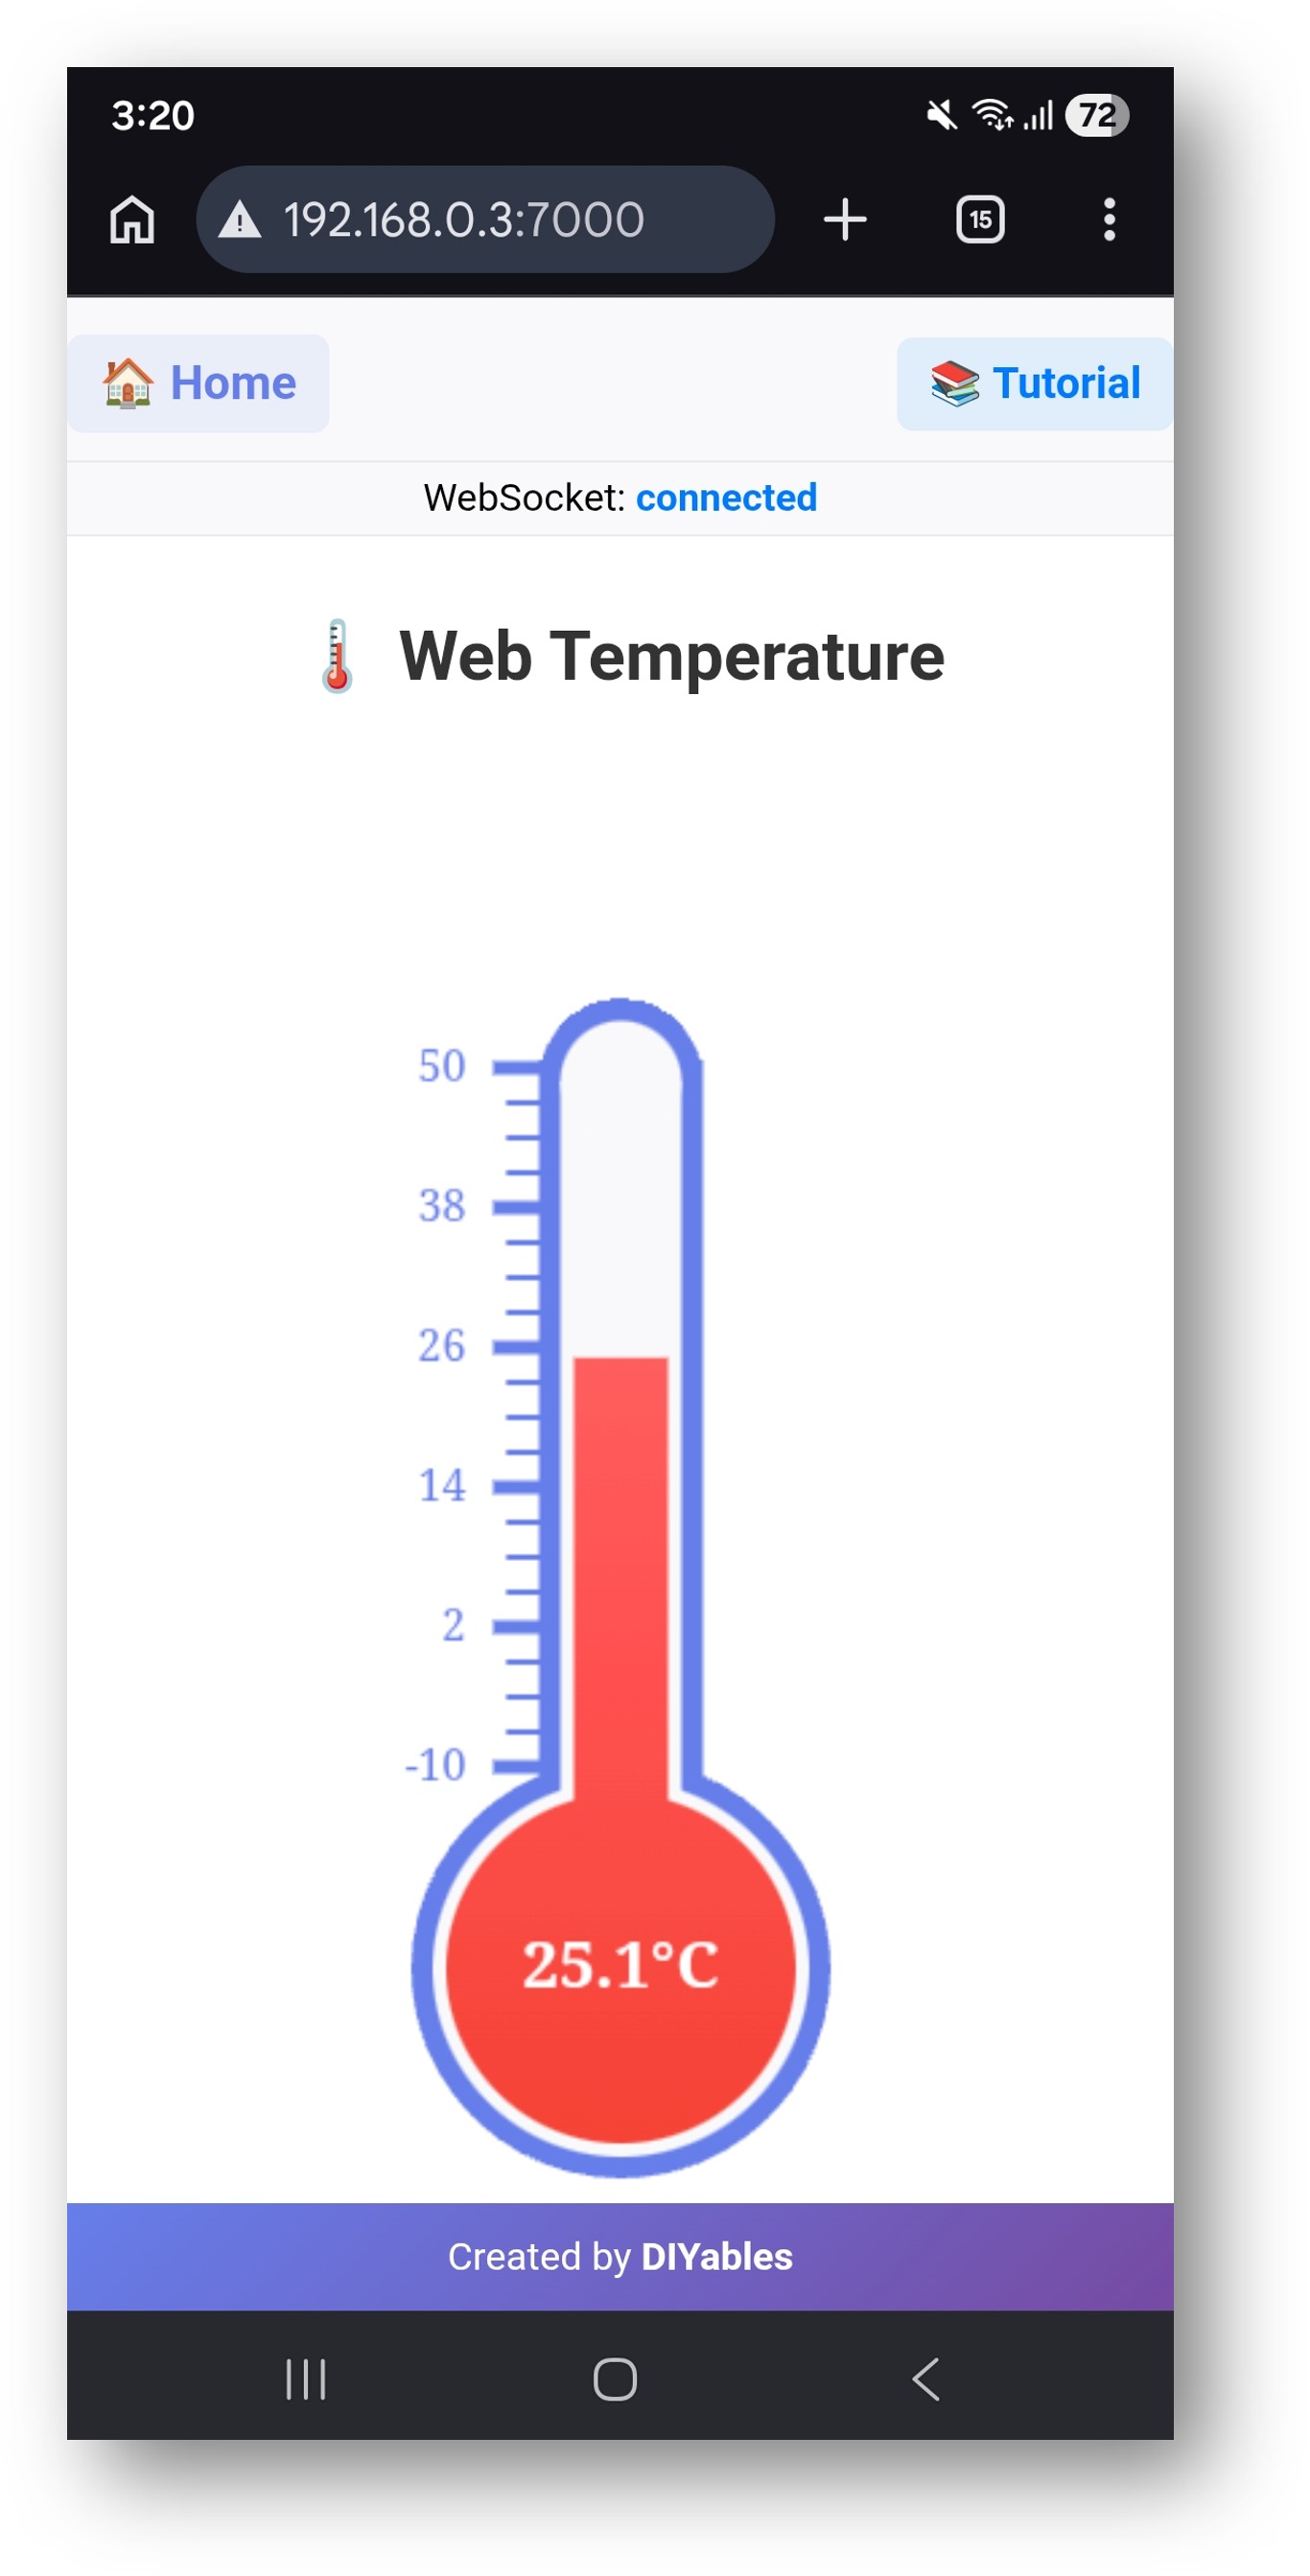
모든 네트워크의 브라우저에서 http://<ARDUINO_UNO_Q_IP>:7000/를 엽니다. WebSocket 연결 상태 표시줄이 있는 라이브 온도계 페이지가 표시됩니다:
페이지는 다음을 표시합니다:
WebSocket 푸시를 통해 실시간으로 상승 및 하강하는 수은 수위가 있는 캔버스 온도계
서버 푸시 시 업데이트되는 전구의 현재 온도 값 및 단위 (°C) (1초마다)
−10 °C ~ 50 °C 눈금 표시 (Python 코드의 MIN_TEMP 및 MAX_TEMP를 통해 구성 가능)
연결 상태 표시줄 — WebSocket이 연결 해제되면 온도계 수은이 회색으로 변합니다
WebSocket 이벤트
브라우저와 Python 서버는 다음 Socket.IO 이벤트를 사용하여 통신합니다:
방향
이벤트
페이로드
브라우저 → 서버
get_config
{}
서버 → 브라우저
temperature_config
{"minValue"
-10, "maxValue"
50, "unit"
"°C"}
브라우저 → 서버
subscribe
{}
서버 → 브라우저
temperature_update
{"value"
24.6}
OpenClaw
You can adapt the OpenClaw to this tutorial by refering the instruction on 아두이노 우노 Q - OpenClaw Tutorial
프로젝트 아이디어
라이브 온도 웹 페이지는 Arduino UNO Q의 많은 실용적인 프로젝트의 기초입니다:
객실 기후 모니터: MCU에 DHT22 또는 BMP280을 추가하고 /api/humidity 엔드포인트로 Python API를 확장합니다 — 웹 페이지는 온도와 습도를 나란히 표시하며 1초마다 업데이트됩니다
냉장고 또는 냉동실 경고: Python 스크립트에 임계값을 설정합니다 — get_temperature가 임계값 이상의 값을 반환하면 스크립트는 냉장고 문이 열려 있을 수 있음을 경고하는 Telegram 메시지를 보냅니다
온도 데이터 로거: 각 읽기를 Linux 측의 CSV 파일에 추가합니다 — /api/history 엔드포인트를 추가하여 마지막 100개 행을 반환하고 두 번째 탭의 Chart.js를 사용하여 차트로 표시합니다
온실 모니터: Arduino UNO Q를 온실에 마운트하고 두 개의 DS18B20 센서 (내부 및 외부)를 사용하며 별도의 Bridge 함수를 통해 둘 다 노출합니다 — 웹 페이지는 분할 온도계 레이아웃에서 두 읽기를 모두 표시합니다
서버실 모니터: 보드를 서버 랙에 마운트합니다 — 빨간색/녹색 상태 배너가 있는 간단한 웹 페이지를 통해 IT 직원이 앱을 설치하지 않고도 모든 디바이스에서 온도를 확인할 수 있습니다
자신을 도전하세요
Arduino UNO Q에서 온도 웹 모니터를 더 진행할 준비가 되셨나요? 다음 과제를 시도하세요:
쉬움:index.html에서 온도계 범위 및 색 구성표를 변경합니다 — 범위를 0–100 °C로 설정하고 현재 읽기에 따라 수은 그래디언트를 파란색 (차가움)에서 빨간색 (뜨거움)으로 변경합니다.
중간: Chart.js를 사용하여 웹 페이지에 두 번째 차트 패널을 추가합니다 — 온도 이력을 선 그래프로 표시하며, 모든 temperature_update WebSocket 이벤트에서 증가하는 JavaScript 배열에 저장된 읽기를 사용하여 처음 1분에 걸쳐 채웁니다.
고급: Python 스크립트에 set_threshold Socket.IO 이벤트를 추가합니다 — 브라우저가 { "min": 18, "max": 28 }로 내보냅니다 — 범위를 Python에 저장하고 푸시 루프에서 확인합니다; 읽기가 범위를 벗어나면 temperature_alert 이벤트를 내보내므로 웹 페이지가 녹색에서 빨간색으로 자동으로 변경되는 경고 배너를 표시합니다.