ESP8266 웹 플로터
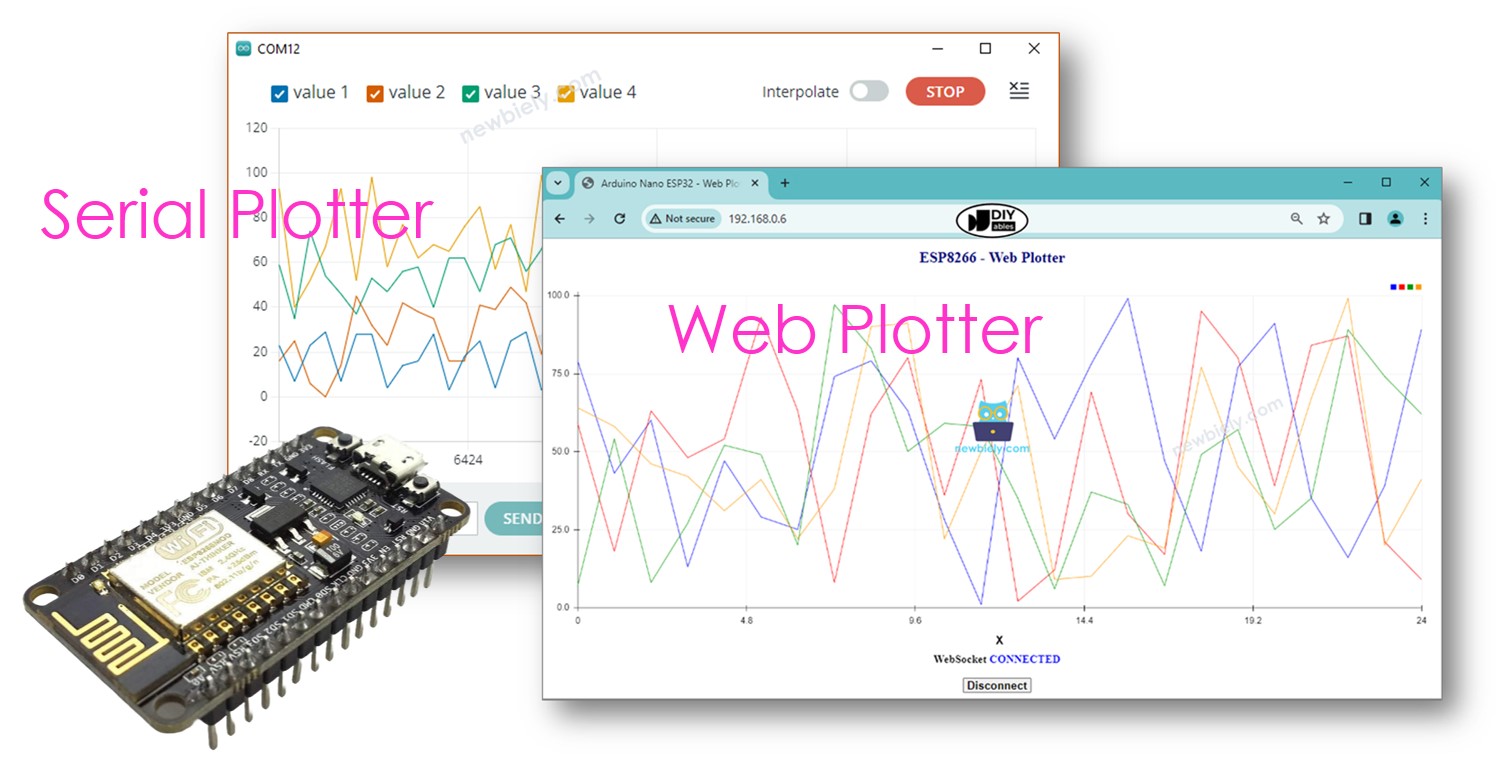
이 튜토리얼은 ESP8266 - 시리얼 플로터에서 찾을 수 있는 Arduino IDE의 시리얼 플로터와 유사한 웹 기반 플로터를 구축하는 방법에 대해 안내합니다. 이 설정을 통해 스마트폰이나 PC의 웹 브라우저를 사용하여 ESP8266에서 실시간 데이터를 편리하게 모니터링할 수 있습니다. Arduino IDE의 시리얼 플로터에서 관찰하는 것과 유사한 그래픽 형식으로 데이터를 시각화할 것입니다.
준비물
| 1 | × | ESP8266 NodeMCU | 쿠팡 | 아마존 | |
| 1 | × | USB 케이블 타입-A to 타입-C (USB-A PC용) | 쿠팡 | 아마존 | |
| 1 | × | USB 케이블 타입-C to 타입-C (USB-C PC용) | 아마존 | |
| 1 | × | (추천) ESP8266용 스크루 터미널 확장 보드 | 쿠팡 | 아마존 | |
| 1 | × | (추천) ESP8266 Type-C용 전원 분배기 | 쿠팡 | 아마존 |
공개: 이 포스팅 에 제공된 일부 링크는 아마존 제휴 링크입니다. 이 포스팅은 쿠팡 파트너스 활동의 일환으로, 이에 따른 일정액의 수수료를 제공받습니다.
웹 플로터 작동 원리
- ESP8266 코드는 웹 서버와 WebSocket 서버를 모두 생성합니다.
- 사용자가 웹 브라우저를 통해 ESP8266 보드에 호스팅된 웹페이지에 접근할 때, ESP8266의 웹 서버는 웹 콘텐츠(HTML, CSS, JavaScript)를 브라우저로 되돌려 보냅니다.
- 웹 브라우저에서 실행 중인 JavaScript 코드는 시리얼 플로터와 유사한 그래프를 렌더링합니다.
- 웹 페이지에서 연결 버튼을 클릭하면, JavaScript 코드가 ESP8266 보드에서 실행되는 WebSocket 서버에 대한 WebSocket 연결을 설정합니다.
- ESP8266은 WebSocket 연결을 통해 시리얼 플로터에서 사용하는 형식과 유사한 형식으로 웹 브라우저에 데이터를 전송합니다(다음 섹션에서 자세한 내용 제공).
- 웹 브라우저의 JavaScript 코드는 데이터를 받아 그래프에 표시합니다.
ESP8266이 웹 플로터에 보내는 데이터 형식
여러 변수를 표시하려면 “\t” 또는 " " 문자로 변수들을 서로 분리해야 합니다. 마지막 값은 “\r\n” 문자로 반드시 종결되어야 합니다.
자세히:
첫 번째 변수
plotter.broadcastTXT(line_1);
중간 변수들
plotter.broadcastTXT("\t"); // 두 값 사이에 탭 '\t' 또는 공백 ' ' 문자가 인쇄됩니다.
plotter.broadcastTXT(line_2);
plotter.broadcastTXT("\t"); // 두 값 사이에 탭 '\t' 또는 공백 ' ' 문자가 인쇄됩니다.
plotter.broadcastTXT(line_3);
마지막 변수
plotter.broadcastTXT("\t"); // 두 값 사이에 탭 '\t' 또는 공백 ' ' 문자가 인쇄됩니다.
plotter.broadcastTXT(line_4);
plotter.broadcastTXT("\r\n"); // 마지막 값은 캐리지 리턴과 개행 문자로 종료됩니다.
더 자세한 내용은 ESP8266 - 시리얼 플로터 튜토리얼을 참조해주세요.
ESP8266 코드 - 웹 플로터
웹 페이지의 콘텐츠(HTML, CSS, JavaScript)는 index.h 파일에 별도로 저장됩니다. 그래서 우리는 Arduino IDE에 두 개의 코드 파일을 가지게 될 것입니다.
- ESP8266 코드인 .ino 파일로, 웹 서버와 웹소켓 서버를 생성합니다.
- 웹페이지의 내용이 포함된 .h 파일입니다.
사용 방법
Arduino IDE에서 ESP8266을 시작하는 방법은 다음과 같습니다:
- ESP8266을 처음 사용하는 경우 ESP8266 - 소프트웨어 설치 튜토리얼을 확인하세요.
- USB 케이블을 사용하여 ESP8266 보드를 컴퓨터에 연결하세요.
- 컴퓨터에서 Arduino IDE를 엽니다.
- 올바른 ESP8266 보드를 선택하세요. 예를 들어, NodeMCU 1.0 (ESP-12E Module)과 해당 COM 포트를 선택하세요.
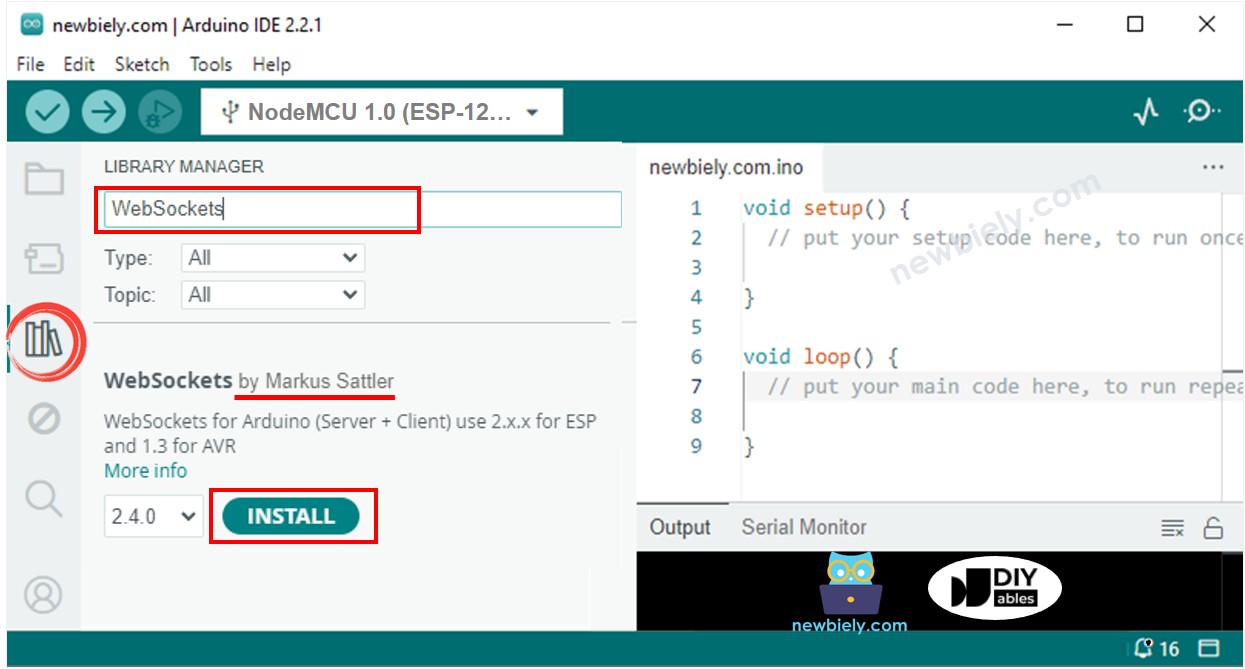
- Arduino IDE의 왼쪽 탐색 바에 있는 Library Manager 아이콘을 클릭하여 라이브러리 관리자를 엽니다.
- “WebSockets”을 검색한 뒤, Markus Sattler이 만든 WebSockets를 찾습니다.
- Install 버튼을 클릭하여 WebSockets 라이브러리를 설치합니다.
- Arduino IDE에서 새 스케치를 만듭니다. 이름을 지정하세요. 예를 들어, newbiely.kr.ino라고 합니다.
- 아래의 코드를 복사하여 Arduino IDE로 엽니다.
/*
* 이 ESP8266 NodeMCU 코드는 newbiely.kr 에서 개발되었습니다
* 이 ESP8266 NodeMCU 코드는 어떠한 제한 없이 공개 사용을 위해 제공됩니다.
* 상세한 지침 및 연결도에 대해서는 다음을 방문하세요:
* https://newbiely.kr/tutorials/esp8266/esp8266-web-plotter
*/
#include <ESP8266WiFi.h>
#include <ESP8266WebServer.h>
#include "index.h" // contains HTML, JavaScript and CSS
const char* ssid = "YOUR_WIFI_SSID"; // CHANGE IT TO MATCH YOUR OWN NETWORK CREDENTIALS
const char* password = "YOUR_WIFI_PASSWORD"; // CHANGE IT TO MATCH YOUR OWN NETWORK CREDENTIALS
ESP8266WebServer server(80); // Web server on port 80
WebSocketsServer plotter = WebSocketsServer(81); // WebSocket server on port 81
int last_update = 0;
void setup() {
Serial.begin(9600);
delay(500);
// Connect to Wi-Fi
WiFi.begin(ssid, password);
while (WiFi.status() != WL_CONNECTED) {
delay(1000);
Serial.println("Connecting to WiFi...");
}
Serial.println("Connected to WiFi");
// Initialize WebSocket server
plotter.begin();
// Serve a basic HTML page with JavaScript to create the WebSocket connection
server.on("/", HTTP_GET, []() {
Serial.println("Web Server: received a web page request");
String html = HTML_CONTENT; // Use the HTML content from the index.h file
server.send(200, "text/html", html);
});
server.begin();
Serial.print("ESP8266 Web Server's IP address: ");
Serial.println(WiFi.localIP());
}
void loop() {
// Handle client requests
server.handleClient();
// Handle WebSocket events
plotter.loop();
if (millis() - last_update > 500) {
last_update = millis();
String line_1 = String(random(0, 100));
String line_2 = String(random(0, 100));
String line_3 = String(random(0, 100));
String line_4 = String(random(0, 100));
// TO SERIAL PLOTTER
Serial.print(line_1);
Serial.print("\t"); // A tab character ('\t') or a space (' ') is printed between the two values.
Serial.print(line_2);
Serial.print("\t"); // A tab character ('\t') or a space (' ') is printed between the two values.
Serial.print(line_3);
Serial.print("\t"); // A tab character ('\t') or a space (' ') is printed between the two values.
Serial.println(line_4); // The last value is terminated by a carriage return ('\r') and a newline ('\n') character.
// TO WEB PLOTTER
plotter.broadcastTXT(line_1);
plotter.broadcastTXT("\t"); // A tab character ('\t') or a space (' ') is printed between the two values.
plotter.broadcastTXT(line_2);
plotter.broadcastTXT("\t"); // A tab character ('\t') or a space (' ') is printed between the two values.
plotter.broadcastTXT(line_3);
plotter.broadcastTXT("\t"); // A tab character ('\t') or a space (' ') is printed between the two values.
plotter.broadcastTXT(line_4);
plotter.broadcastTXT("\r\n"); // The last value is terminated by a carriage return ('\r') and a newline ('\n') character.
}
}
- 코드 내의 WiFi 정보(SSID 및 비밀번호)를 자신의 네트워크 자격 증명과 일치하도록 수정하십시오.
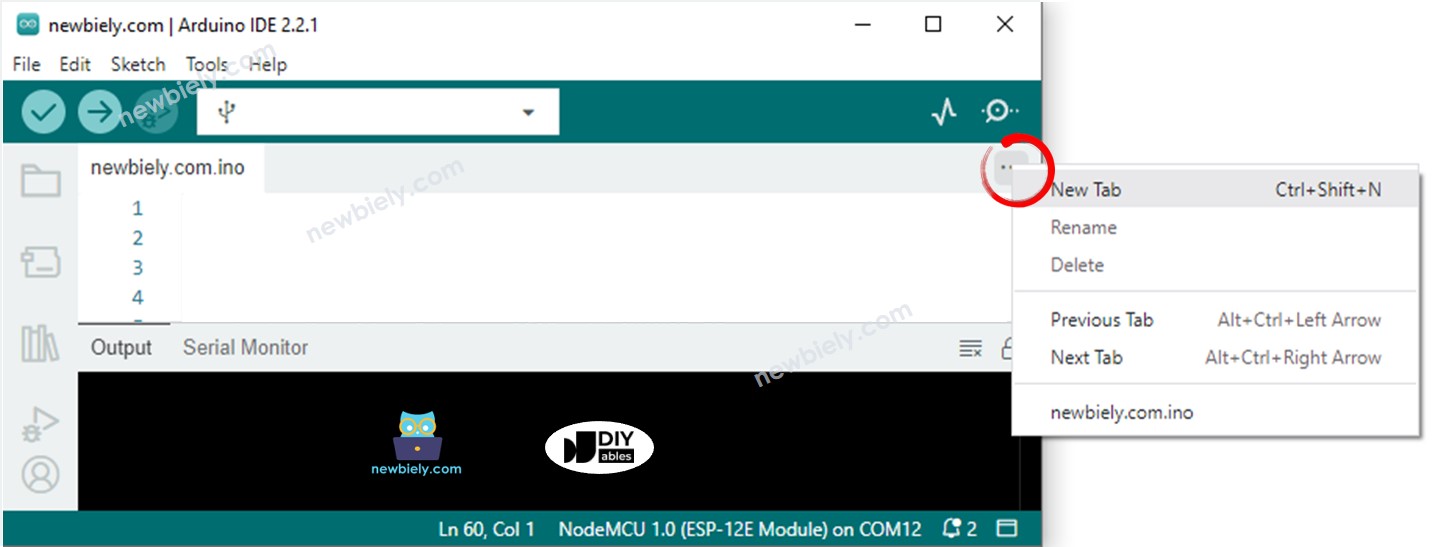
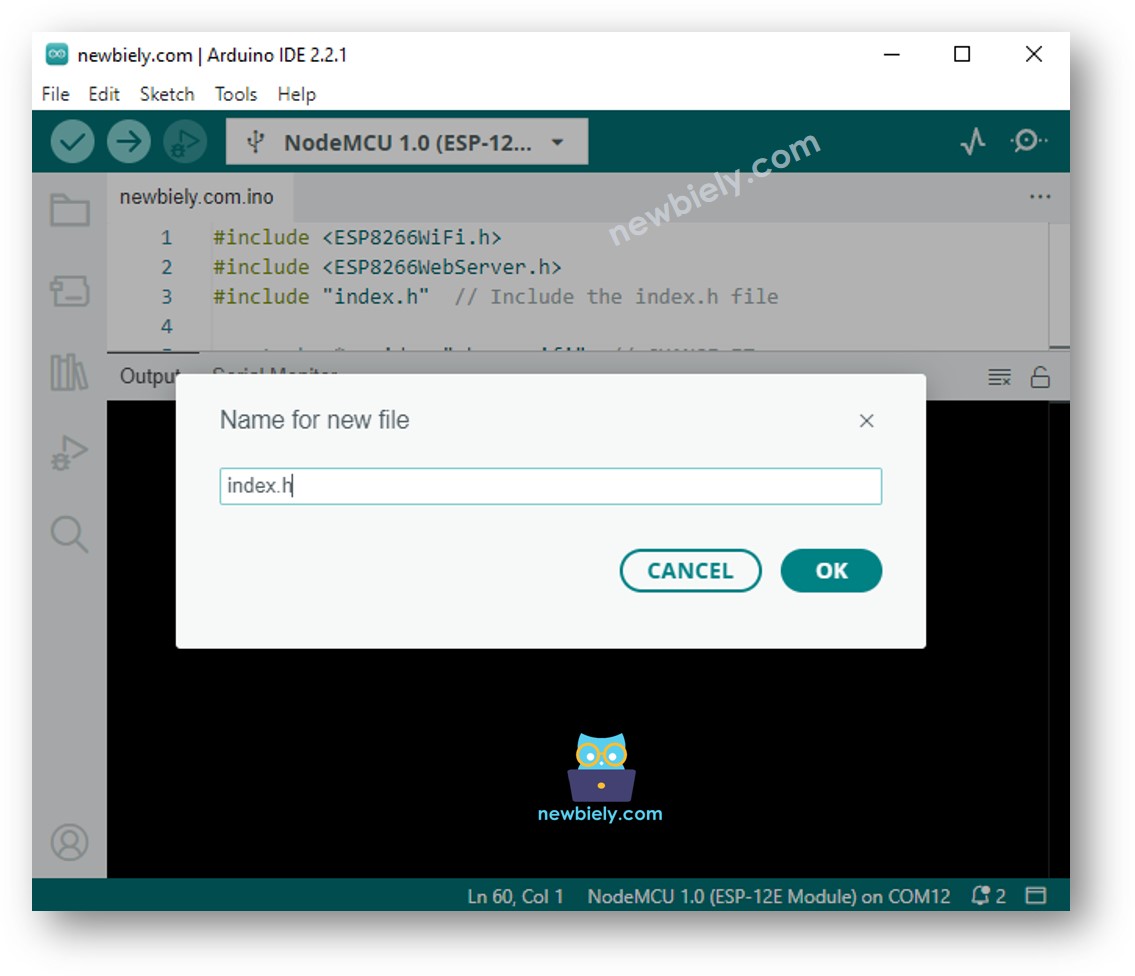
- Arduino IDE에서 index.h 파일을 생성하려면:
- 직렬 모니터 아이콘 아래에 있는 버튼을 클릭하고 새 탭을 선택하거나, Ctrl+Shift+N 키를 사용하십시오.
- 파일 이름을 index.h로 지정하고 OK 버튼을 클릭하세요
- 아래의 코드를 복사하여 index.h에 붙여넣으세요.
- 이제 코드가 두 파일에 있습니다: newbiely.kr.ino와 index.h
- Arduino IDE에서 Upload 버튼을 클릭하여 ESP8266에 코드를 업로드합니다.
- 시리얼 모니터를 엽니다.
- 시리얼 모니터에서 결과를 확인하세요.
- 표시된 IP 주소를 기록해두고, 이 주소를 스마트폰이나 PC의 웹 브라우저의 주소창에 입력하세요.
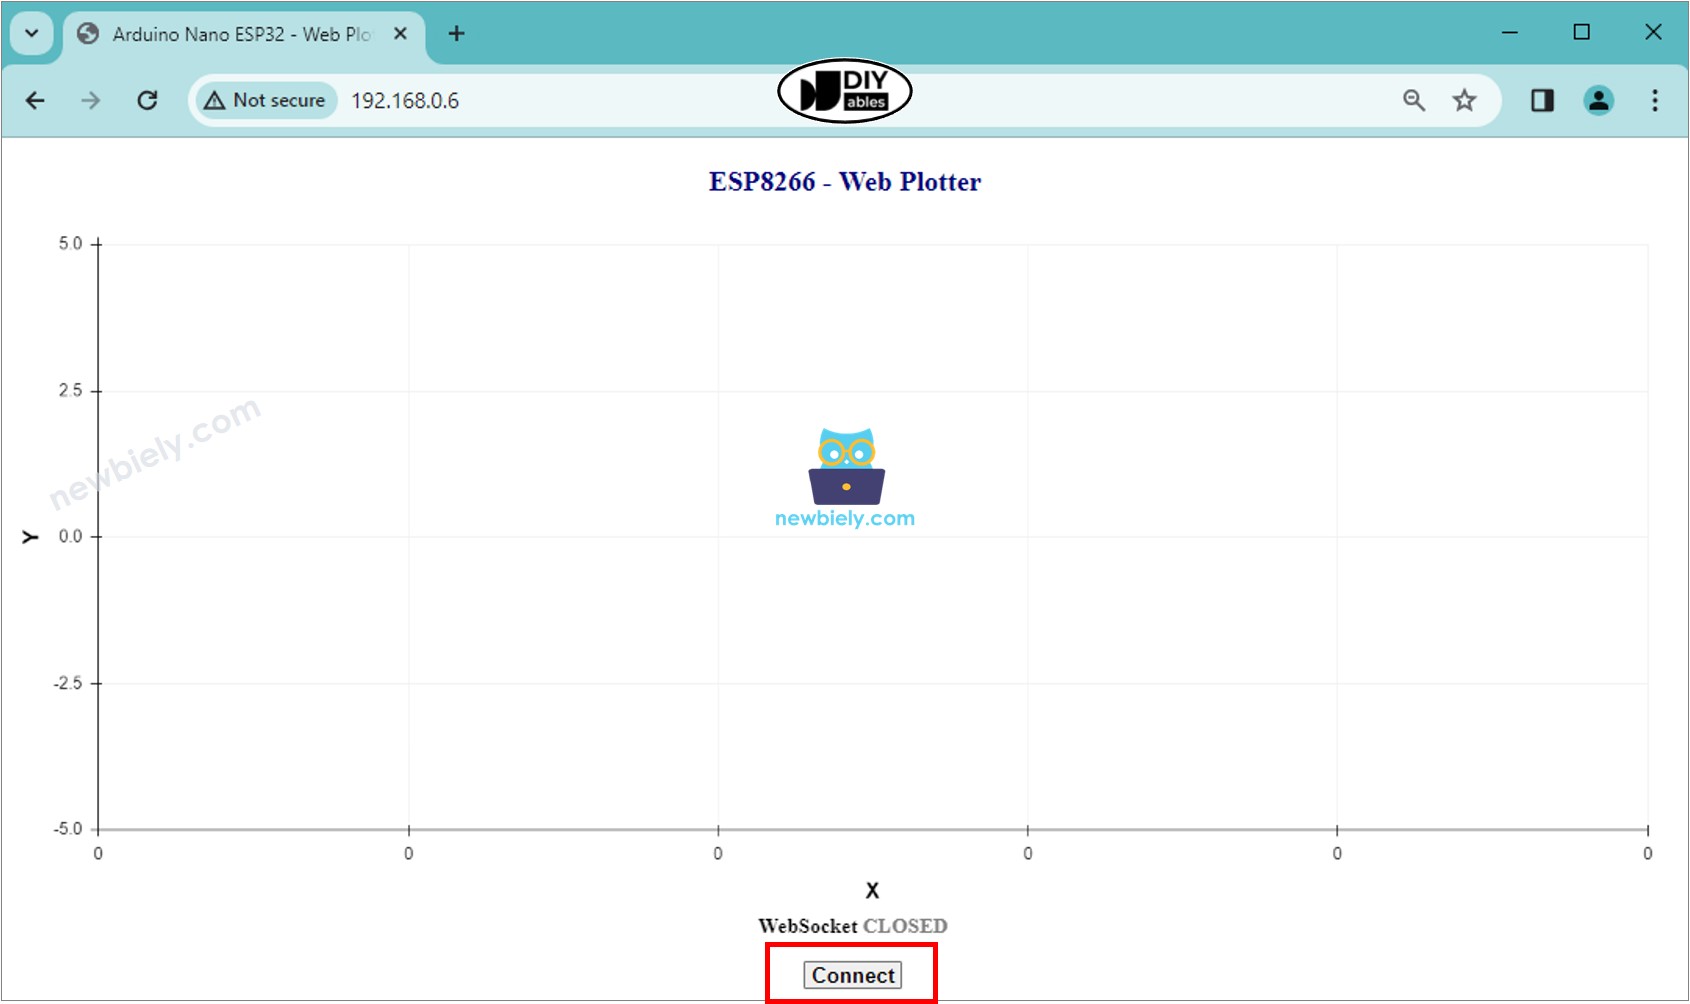
- 아래와 같이 웹페이지가 표시될 것입니다:
- WebSocket을 통해 웹페이지를 ESP8266에 연결하려면 CONNECT 버튼을 클릭하세요.
- 아래 이미지와 같이 플롯터가 데이터를 플롯하는 것을 볼 수 있습니다.
- index.h에서 HTML 콘텐츠를 수정하고 newbiely.kr.ino 파일은 건드리지 않은 경우, ESP8266에 코드를 컴파일하고 업로드 할 때 Arduino IDE는 HTML 콘텐츠를 업데이트하지 않습니다.
- 이 경우 Arduino IDE가 HTML 콘텐츠를 업데이트하려면, newbiely.kr.ino 파일에서 변경을 하세요(예: 빈 줄 추가, 주석 추가 등).
/*
* 이 ESP8266 NodeMCU 코드는 newbiely.kr 에서 개발되었습니다
* 이 ESP8266 NodeMCU 코드는 어떠한 제한 없이 공개 사용을 위해 제공됩니다.
* 상세한 지침 및 연결도에 대해서는 다음을 방문하세요:
* https://newbiely.kr/tutorials/esp8266/esp8266-web-plotter
*/
const char *HTML_CONTENT = R"=====(
<!DOCTYPE html>
<html>
<head>
<title>ESP8266 - Web Plotter</title>
<meta name="viewport" content="width=device-width, initial-scale=0.7">
<style>
body {text-align: center; height: 750px; }
h1 {font-weight: bold; font-size: 20pt; padding-bottom: 5px; color: navy; }
h2 {font-weight: bold; font-size: 15pt; padding-bottom: 5px; }
button {font-weight: bold; font-size: 15pt; }
#footer {width: 100%; margin: 0px; padding: 0px 0px 10px 0px; bottom: 0px; }
.sub-footer {margin: 0 auto; position: relative; width:400px; }
.sub-footer a {position: absolute; font-size: 10pt; top: 3px; }
</style>
<script>
var COLOR_BACKGROUND = "#FFFFFF";
var COLOR_TEXT = "#000000";
var COLOR_BOUND = "#000000";
var COLOR_GRIDLINE = "#F0F0F0";
var COLOR_LINE = ["#0000FF", "#FF0000", "#009900", "#FF9900", "#CC00CC", "#666666", "#00CCFF", "#000000"];
var LEGEND_WIDTH = 10;
var X_TITLE_HEIGHT = 40;
var Y_TITLE_WIDTH = 40;
var X_VALUE_HEIGHT = 40;
var Y_VALUE_WIDTH = 50;
var PLOTTER_PADDING_TOP = 30;
var PLOTTER_PADDING_RIGHT = 30;
var X_GRIDLINE_NUM = 5;
var Y_GRIDLINE_NUM = 4;
var WSP_WIDTH = 400;
var WSP_HEIGHT = 200;
var MAX_SAMPLE = 50; // in sample
var X_MIN = 0;
var X_MAX = MAX_SAMPLE;
var Y_MIN = -5;
var Y_MAX = 5;
var X_TITLE = "X";
var Y_TITLE = "Y";
var plotter_width;
var plotter_height;
var plotter_pivot_x;
var plotter_pivot_y;
var sample_count = 0;
var buffer = "";
var data = [];
var webSocket;
var canvas;
var ctx;
function plotter_init(){
canvas = document.getElementById("graph");
canvas.style.backgroundColor = COLOR_BACKGROUND;
ctx = canvas.getContext("2d");
canvas_resize();
setInterval(update_plotter, 1000 / 60);
}
function plotter_to_esp8266(){
if(webSocket == null){
webSocket = new WebSocket("ws://" + window.location.host + ":81");
document.getElementById("ws_state").innerHTML = "CONNECTING";
webSocket.onopen = ws_onopen;
webSocket.onclose = ws_onclose;
webSocket.onmessage = ws_onmessage;
webSocket.binaryType = "arraybuffer";
}
else
webSocket.close();
}
function ws_onopen(){
document.getElementById("ws_state").innerHTML = "<span style='color: blue'>CONNECTED</span>";
document.getElementById("btn_connect").innerHTML = "Disconnect";
}
function ws_onclose(){
document.getElementById("ws_state").innerHTML = "<span style='color: gray'>CLOSED</span>";
document.getElementById("btn_connect").innerHTML = "Connect";
webSocket.onopen = null;
webSocket.onclose = null;
webSocket.onmessage = null;
webSocket = null;
}
function ws_onmessage(e_msg){
e_msg = e_msg || window.event; // MessageEvent
console.log(e_msg.data);
buffer += e_msg.data;
buffer = buffer.replace(/\r\n/g, "\n");
buffer = buffer.replace(/\r/g, "\n");
while(buffer.indexOf("\n") == 0)
buffer = buffer.substr(1);
if(buffer.indexOf("\n") <= 0)
return;
var pos = buffer.lastIndexOf("\n");
var str = buffer.substr(0, pos);
var new_sample_arr = str.split("\n");
buffer = buffer.substr(pos + 1);
for(var si = 0; si < new_sample_arr.length; si++) {
var str = new_sample_arr[si];
var arr = [];
if(str.indexOf("\t") > 0)
arr = str.split("\t");
else
arr = str.split(" ");
for(var i = 0; i < arr.length; i++){
var value = parseFloat(arr[i]);
if(isNaN(value))
continue;
if(i >= data.length) {
var new_line = [value];
data.push(new_line); // new line
}
else
data[i].push(value);
}
sample_count++;
}
for(var line = 0; line < data.length; line++){
while(data[line].length > MAX_SAMPLE)
data[line].splice(0, 1);
}
auto_scale();
}
function map(x, in_min, in_max, out_min, out_max){
return (x - in_min) * (out_max - out_min) / (in_max - in_min) + out_min;
}
function get_random_color(){
var letters = '0123456789ABCDEF';
var _color = '#';
for (var i = 0; i < 6; i++)
_color += letters[Math.floor(Math.random() * 16)];
return _color;
}
function update_plotter(){
if(sample_count <= MAX_SAMPLE)
X_MAX = sample_count;
else
X_MAX = 50;
ctx.clearRect(0, 0, WSP_WIDTH, WSP_HEIGHT);
ctx.save();
ctx.translate(plotter_pivot_x, plotter_pivot_y);
ctx.font = "bold 20px Arial";
ctx.textBaseline = "middle";
ctx.textAlign = "center";
ctx.fillStyle = COLOR_TEXT;
// draw X axis title
if(X_TITLE != "")
ctx.fillText(X_TITLE, plotter_width / 2, X_VALUE_HEIGHT + X_TITLE_HEIGHT / 2);
// draw Y axis title
if(Y_TITLE != ""){
ctx.rotate(-90 * Math.PI / 180);
ctx.fillText(Y_TITLE, plotter_height / 2, -Y_VALUE_WIDTH - Y_TITLE_WIDTH / 2);
ctx.rotate(90 * Math.PI / 180);
}
ctx.font = "16px Arial";
ctx.textAlign = "right";
ctx.strokeStyle = COLOR_BOUND;
for(var i = 0; i <= Y_GRIDLINE_NUM; i++){
var y_gridline_px = -map(i, 0, Y_GRIDLINE_NUM, 0, plotter_height);
y_gridline_px = Math.round(y_gridline_px) + 0.5;
ctx.beginPath();
ctx.moveTo(0, y_gridline_px);
ctx.lineTo(plotter_width, y_gridline_px);
ctx.stroke();
ctx.strokeStyle = COLOR_BOUND;
ctx.beginPath();
ctx.moveTo(-7 , y_gridline_px);
ctx.lineTo(4, y_gridline_px);
ctx.stroke();
var y_gridline_value = map(i, 0, Y_GRIDLINE_NUM, Y_MIN, Y_MAX);
y_gridline_value = y_gridline_value.toFixed(1);
ctx.fillText(y_gridline_value + "", -15, y_gridline_px);
ctx.strokeStyle = COLOR_GRIDLINE;
}
ctx.strokeStyle = COLOR_BOUND;
ctx.textAlign = "center";
ctx.beginPath();
ctx.moveTo(0.5, y_gridline_px - 7);
ctx.lineTo(0.5, y_gridline_px + 4);
ctx.stroke();
for(var i = 0; i <= X_GRIDLINE_NUM; i++){
var x_gridline_px = map(i, 0, X_GRIDLINE_NUM, 0, plotter_width);
x_gridline_px = Math.round(x_gridline_px) + 0.5;
ctx.beginPath();
ctx.moveTo(x_gridline_px, 0);
ctx.lineTo(x_gridline_px, -plotter_height);
ctx.stroke();
ctx.strokeStyle = COLOR_BOUND;
ctx.beginPath();
ctx.moveTo(x_gridline_px, 7);
ctx.lineTo(x_gridline_px, -4);
ctx.stroke();
var x_gridline_value;
if(sample_count <= MAX_SAMPLE)
x_gridline_value = map(i, 0, X_GRIDLINE_NUM, X_MIN, X_MAX);
else
x_gridline_value = map(i, 0, X_GRIDLINE_NUM, sample_count - MAX_SAMPLE, sample_count);;
ctx.fillText(x_gridline_value.toString(), x_gridline_px, X_VALUE_HEIGHT / 2 + 5);
ctx.strokeStyle = COLOR_GRIDLINE;
}
var line_num = data.length;
for(var line = 0; line < line_num; line++){
// draw graph
var sample_num = data[line].length;
if(sample_num >= 2){
var y_value = data[line][0];
var x_px = 0;
var y_px = -map(y_value, Y_MIN, Y_MAX, 0, plotter_height);
if(line == COLOR_LINE.length)
COLOR_LINE.push(get_random_color());
ctx.strokeStyle = COLOR_LINE[line];
ctx.beginPath();
ctx.moveTo(x_px, y_px);
for(var i = 0; i < sample_num; i++){
y_value = data[line][i];
x_px = map(i, X_MIN, X_MAX -1, 0, plotter_width);
y_px = -map(y_value, Y_MIN, Y_MAX, 0, plotter_height);
ctx.lineTo(x_px, y_px);
}
ctx.stroke();
}
// draw legend
var x = plotter_width - (line_num - line) * LEGEND_WIDTH - (line_num - line - 1) * LEGEND_WIDTH / 2;
var y = -plotter_height - PLOTTER_PADDING_TOP / 2 - LEGEND_WIDTH / 2;
ctx.fillStyle = COLOR_LINE[line];
ctx.beginPath();
ctx.rect(x, y, LEGEND_WIDTH, LEGEND_WIDTH);
ctx.fill();
}
ctx.restore();
}
function canvas_resize(){
canvas.width = 0; // to avoid wrong screen size
canvas.height = 0;
document.getElementById('footer').style.position = "fixed";
var width = window.innerWidth - 20;
var height = window.innerHeight - 20;
WSP_WIDTH = width;
WSP_HEIGHT = height - document.getElementById('header').offsetHeight - document.getElementById('footer').offsetHeight;
canvas.width = WSP_WIDTH;
canvas.height = WSP_HEIGHT;
ctx.font = "16px Arial";
var y_min_text_size = ctx.measureText(Y_MIN.toFixed(1) + "").width;
var y_max_text_size = ctx.measureText(Y_MAX.toFixed(1) + "").width;
Y_VALUE_WIDTH = Math.round(Math.max(y_min_text_size, y_max_text_size)) + 15;
plotter_width = WSP_WIDTH - Y_VALUE_WIDTH - PLOTTER_PADDING_RIGHT;
plotter_height = WSP_HEIGHT - X_VALUE_HEIGHT - PLOTTER_PADDING_TOP;
plotter_pivot_x = Y_VALUE_WIDTH;
plotter_pivot_y = WSP_HEIGHT - X_VALUE_HEIGHT;
if(X_TITLE != "") {
plotter_height -= X_TITLE_HEIGHT;
plotter_pivot_y -= X_TITLE_HEIGHT;
}
if(Y_TITLE != "") {
plotter_width -= Y_TITLE_WIDTH;
plotter_pivot_x += Y_TITLE_WIDTH;
}
ctx.lineWidth = 1;
}
function auto_scale(){
if(data.length >= 1){
var max_arr = [];
var min_arr = [];
for(var i = 0; i < data.length; i++){
if(data[i].length >= 1){
var max = Math.max.apply(null, data[i]);
var min = Math.min.apply(null, data[i]);
max_arr.push(max);
min_arr.push(min);
}
}
var max = Math.max.apply(null, max_arr);
var min = Math.min.apply(null, min_arr);
var MIN_DELTA = 10.0;
if((max - min) < MIN_DELTA){
var mid = (max + min) / 2;
max = mid + MIN_DELTA / 2;
min = mid - MIN_DELTA / 2;
}
var range = max - min;
var exp;
if (range == 0.0)
exp = 0;
else
exp = Math.floor(Math.log10(range / 4));
var scale = Math.pow(10, exp);
var raw_step = (range / 4) / scale;
var step;
potential_steps =[1.0, 1.5, 2.0, 2.5, 3.0, 4.0, 5.0, 6.0, 8.0, 10.0];
for (var i = 0; i < potential_steps.length; i++) {
if (potential_steps[i] < raw_step)
continue;
step = potential_steps[i] * scale;
Y_MIN = step * Math.floor(min / step);
Y_MAX = Y_MIN + step * (4);
if (Y_MAX >= max)
break;
}
var count = 5 - Math.floor((Y_MAX - max) / step);
Y_MAX = Y_MIN + step * (count - 1);
ctx.font = "16px Arial";
var y_min_text_size = ctx.measureText(Y_MIN.toFixed(1) + "").width;
var y_max_text_size = ctx.measureText(Y_MAX.toFixed(1) + "").width;
Y_VALUE_WIDTH = Math.round(Math.max(y_min_text_size, y_max_text_size)) + 15;
plotter_width = WSP_WIDTH - Y_VALUE_WIDTH - PLOTTER_PADDING_RIGHT;
plotter_pivot_x = Y_VALUE_WIDTH;
}
}
window.onload = plotter_init;
</script>
</head>
<body onresize="canvas_resize()">
<h1 id="header">ESP8266 - Web Plotter</h1>
<canvas id="graph"></canvas>
<br>
<div id="footer">
<div class="sub-footer">
<h2>WebSocket <span id="ws_state"><span style="color: gray">CLOSED</span></span></h2>
</div>
<button id="btn_connect" type="button" onclick="plotter_to_esp8266();">Connect</button>
</div>
</body>
</html>
)=====";
COM6
Connecting to WiFi...
Connected to WiFi
ESP8266 Web Server's IP address IP address: 192.168.0.2
Autoscroll
Clear output
9600 baud
Newline
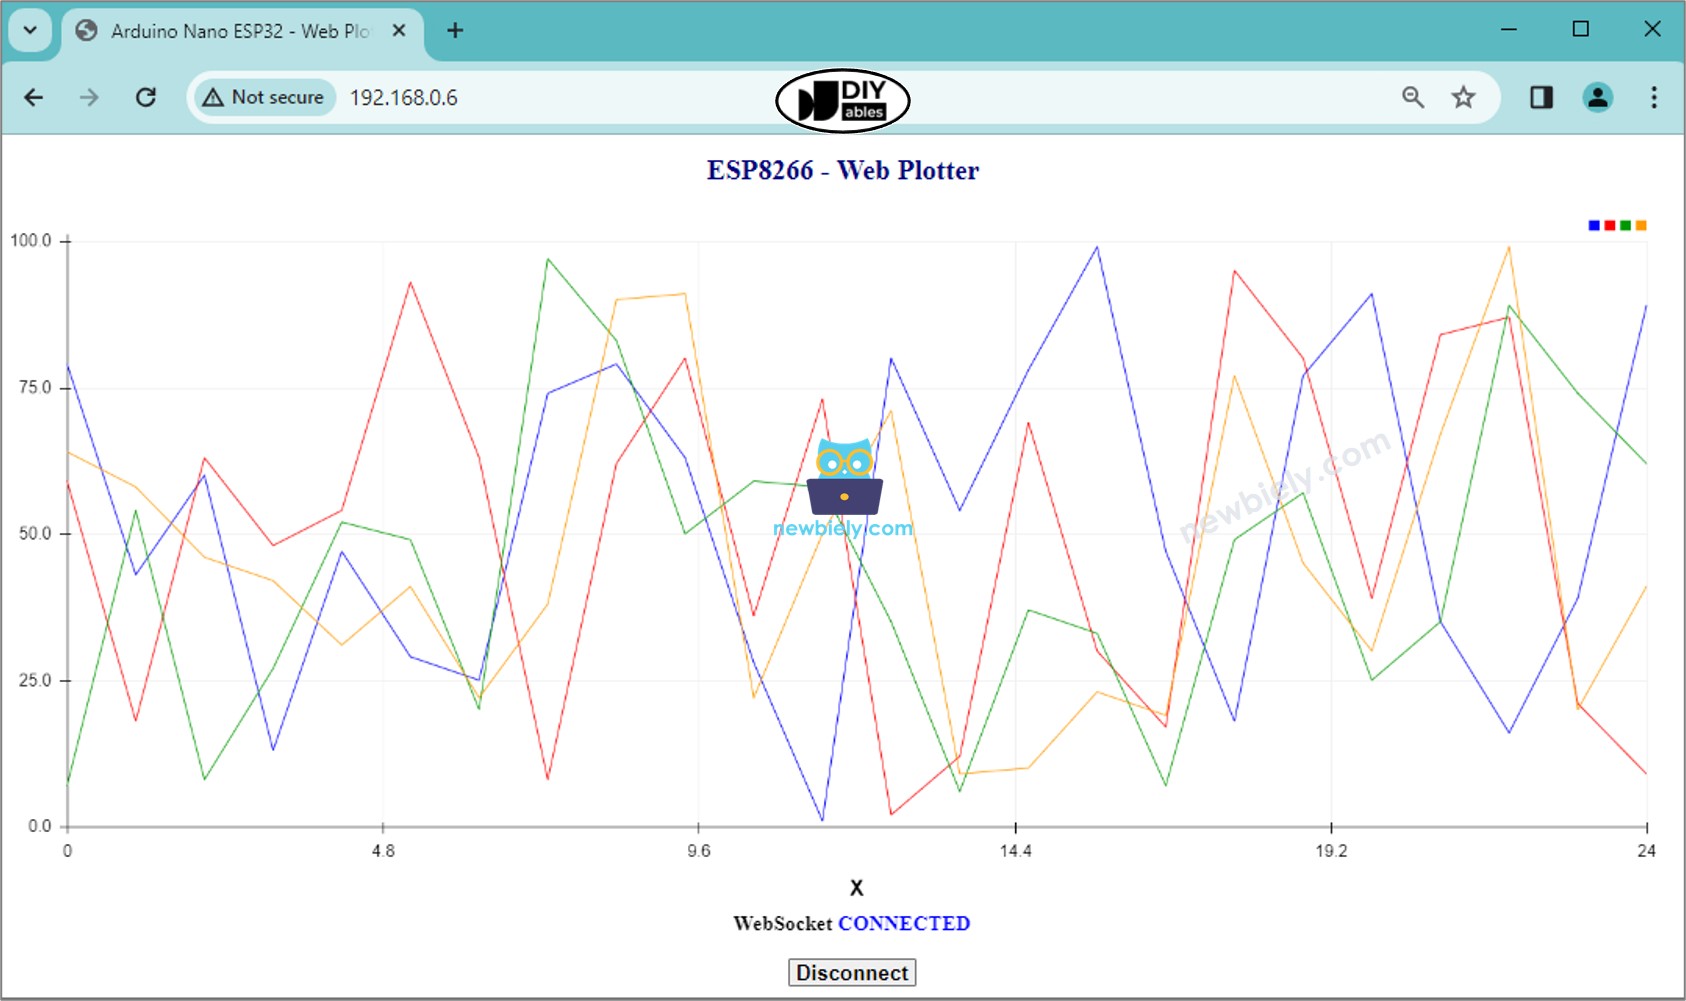
아두이노 IDE에서 시리얼 플로터를 열어 웹 브라우저의 웹 플로터와 비교할 수 있습니다.
※ 주의:
코드 줄별 설명
위의 ESP8266 코드에는 줄마다 설명이 포함되어 있습니다. 코드의 주석을 읽어주세요!
