DIYables ESP32 WebApps 라이브러리를 사용한 아두이노 나노 ESP32 웹 플로터
개요
이 튜토리얼은 DIYables ESP32 WebApps 라이브러리의 DIYablesWebPlotterPage 클래스를 다룹니다. 이 페이지는 브라우저에서 스트리밍 꺾은선 차트를 렌더링합니다. Arduino Nano ESP32 스케치가 WebSocket을 통해 데이터 포인트를 보내면, 브라우저가 각 포인트를 실시간으로 해당 시리즈에 추가합니다. 최대 8개의 독립적인 데이터 시리즈를 동시에 지원합니다.
DHT 센서를 웹 플로터 앱과 사용하는 방법을 보여주는 단계별 영상 튜토리얼:
이 튜토리얼에서 다루는 내용
- 플로터 제목, 축 레이블, 샘플 유지 한도 구성하기
- addDataPoint()를 사용하여 스케치에서 명명된 데이터 포인트 보내기
- 여러 시리즈를 동시에 플로팅하기
- 시뮬레이션 데이터를 실제 센서 읽음값으로 교체하기
준비물
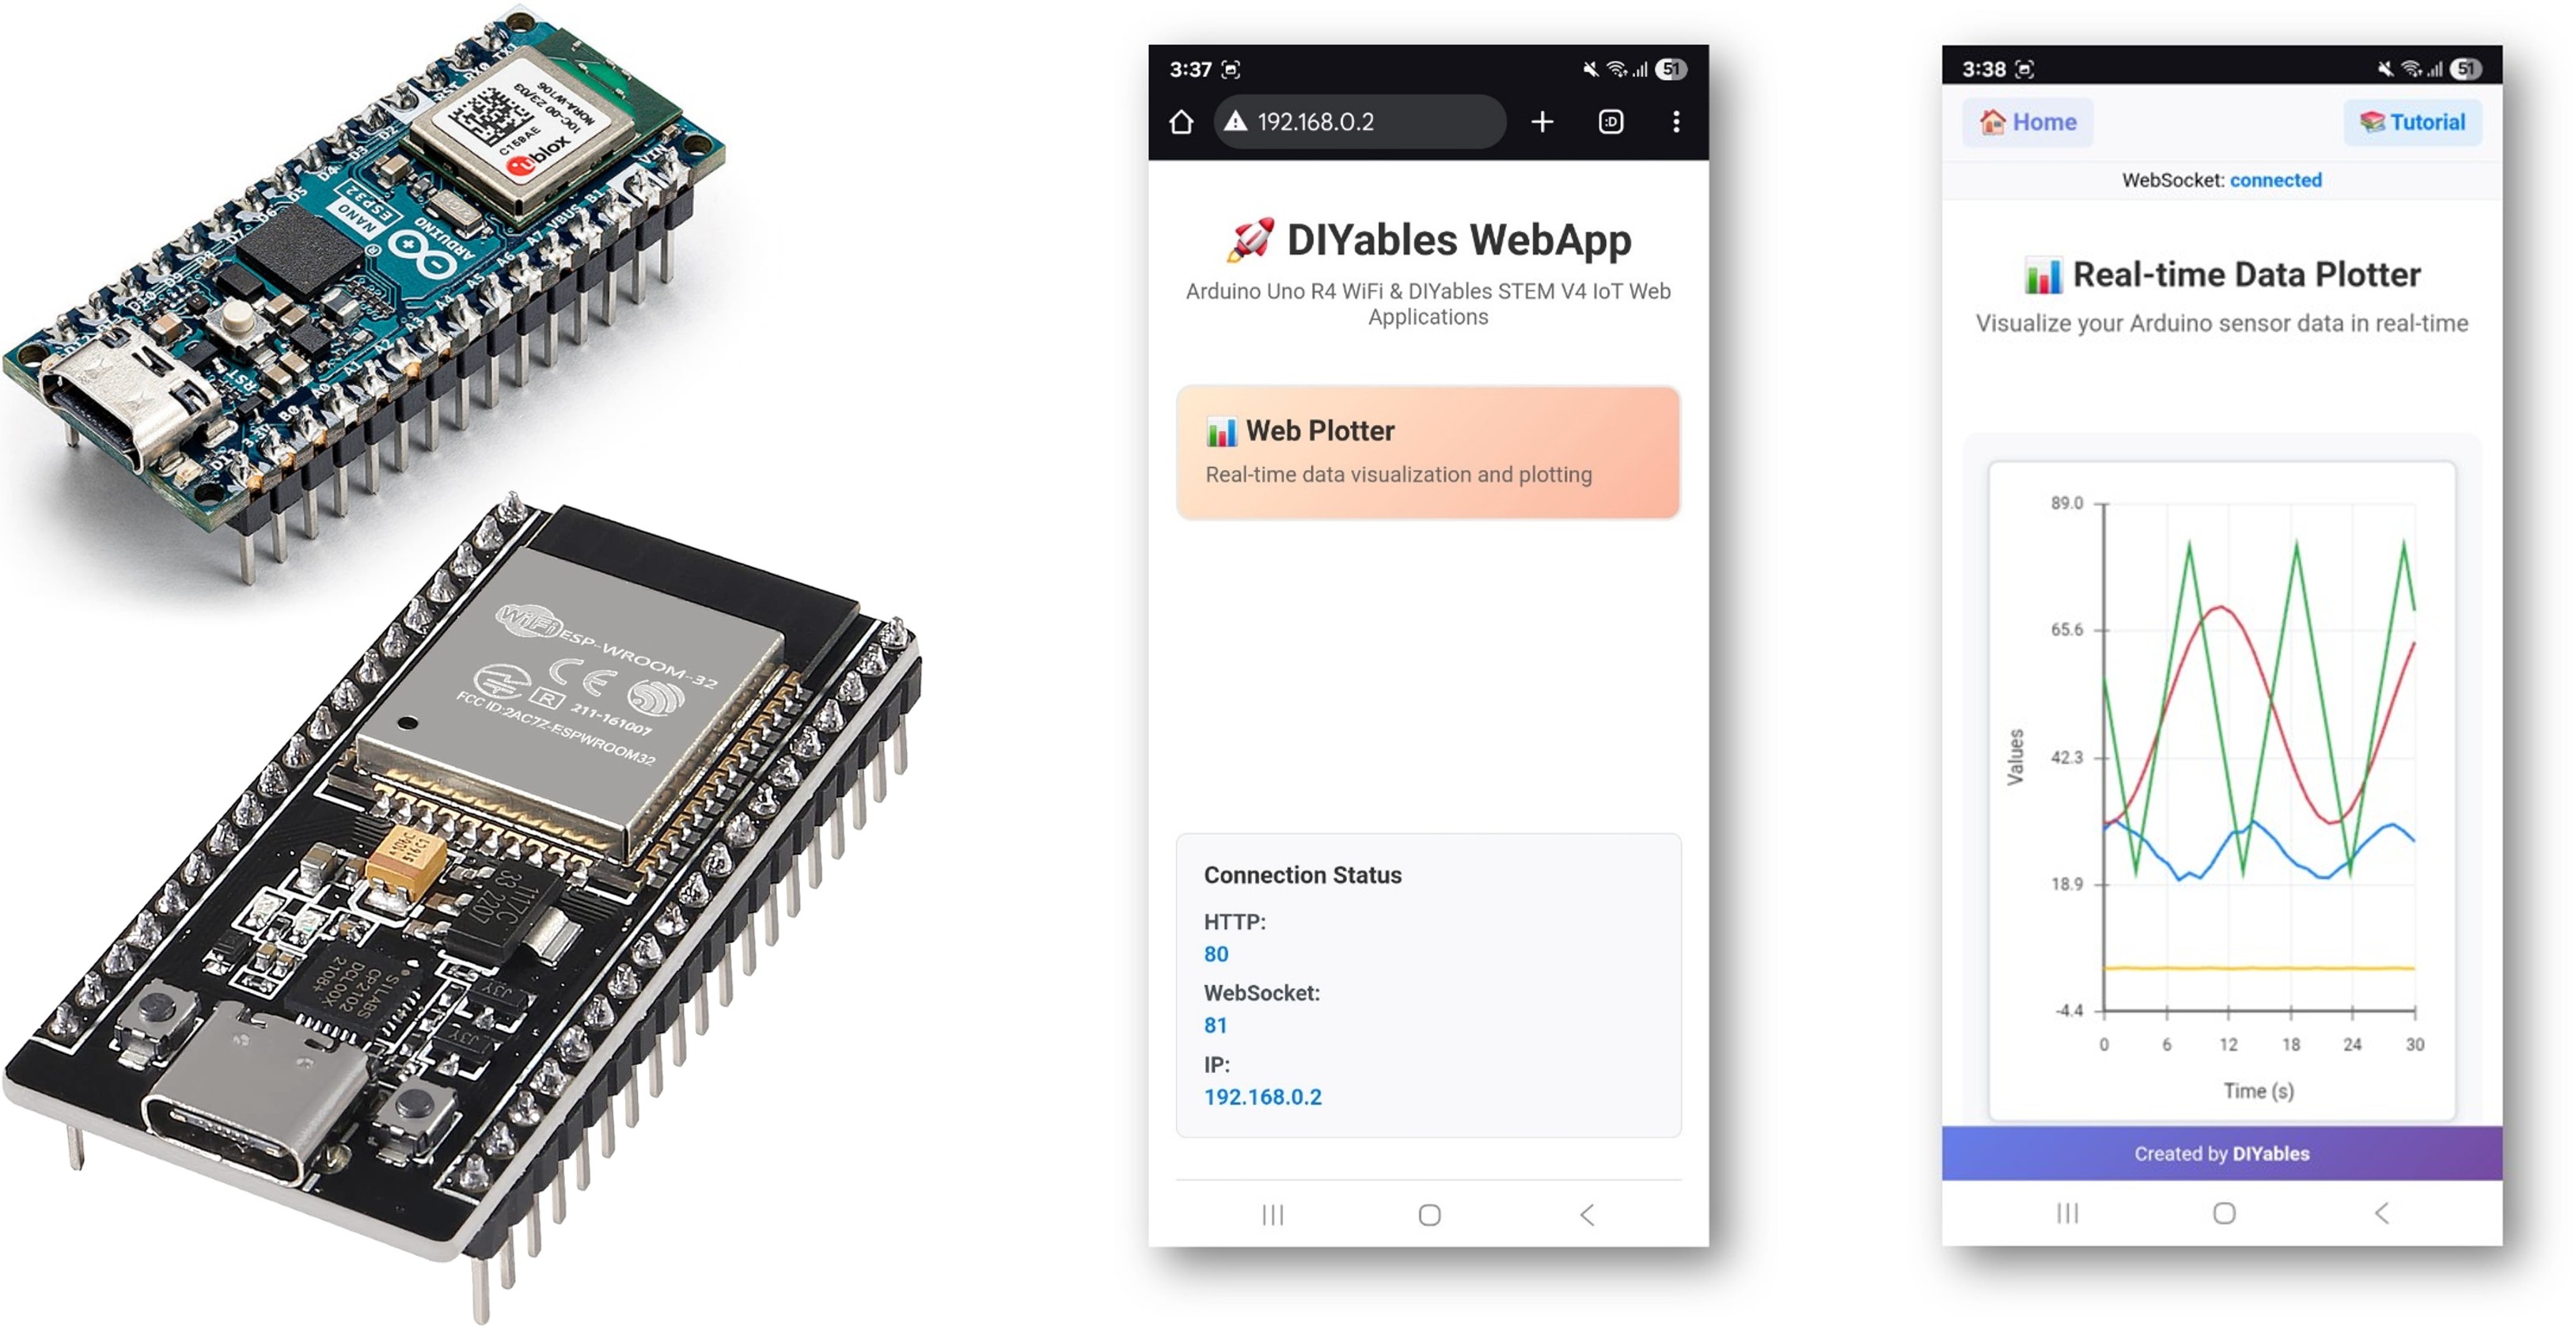
| 1 | × | 아두이노 나노 ESP32 | 쿠팡 | 아마존 | |
| 1 | × | USB 케이블 타입-A to 타입-C (USB-A PC용) | 쿠팡 | 아마존 | |
| 1 | × | USB 케이블 타입-C to 타입-C (USB-C PC용) | 아마존 | |
| 1 | × | (추천) 아두이노 나노용 스크루 터미널 확장 보드 | 쿠팡 | 아마존 | |
| 1 | × | (추천) 아두이노 나노용 브레이크아웃 확장 보드 | 쿠팡 | 아마존 | |
| 1 | × | (추천) 아두이노 나노 ESP32용 전원 분배기 | 쿠팡 | 아마존 |
공개: 이 포스팅 에 제공된 일부 링크는 아마존 제휴 링크입니다. 이 포스팅은 쿠팡 파트너스 활동의 일환으로, 이에 따른 일정액의 수수료를 제공받습니다.
단계
다음 지침을 단계별로 따르세요:
- Arduino Nano ESP32가 처음이라면, 아두이노 나노 ESP32 - 소프트웨어 설치 튜토리얼을 참조하세요.
- USB 케이블을 사용하여 Arduino Nano ESP32 보드를 컴퓨터에 연결합니다.
- 컴퓨터에서 Arduino IDE를 실행합니다.
- 적절한 보드(예: Arduino Nano ESP32)와 COM 포트를 선택합니다.
- Arduino IDE 왼쪽 바의 Libraries 아이콘으로 이동합니다.
- "DIYables ESP32 WebApps"를 검색하여 DIYables의 DIYables ESP32 WebApps 라이브러리를 찾습니다
- Install 버튼을 클릭하여 라이브러리를 설치합니다.
- Search for DIYables ESP32 WebApps created by DIYables and click the Install button.
1
void setup() {
- 다른 라이브러리 의존성 설치 요청을 받게 됩니다
- Install All 버튼을 클릭하여 모든 라이브러리 의존성을 설치합니다.
- Arduino IDE에서 File Examples DIYables ESP32 WebApps WebPlotter 예제로 이동하거나, 위의 코드를 복사하여 Arduino IDE 편집기에 붙여넣습니다
/*
* DIYables WebApp Library - Web Plotter Example
*
* This example demonstrates the Web Plotter feature:
* - Real-time data visualization
* - Multiple data series support
* - Auto-scaling Y-axis
* - Responsive web interface
* - WebSocket communication for instant updates
*
* Hardware: ESP32 Boards
*
* Setup:
* 1. Update WiFi credentials below
* 2. Upload the sketch to your Arduino
* 3. Open Serial Monitor to see the IP address
* 4. Navigate to http://[IP_ADDRESS]/webplotter
*/
#include <DIYables_ESP32_Platform.h>
#include <DIYablesWebApps.h>
// WiFi credentials - UPDATE THESE WITH YOUR NETWORK
const char WIFI_SSID[] = "YOUR_WIFI_SSID";
const char WIFI_PASSWORD[] = "YOUR_WIFI_PASSWORD";
// Create WebApp server and page instances
ESP32ServerFactory serverFactory;
DIYablesWebAppServer webAppsServer(serverFactory, 80, 81);
DIYablesHomePage homePage;
DIYablesWebPlotterPage webPlotterPage;
// Simulation variables
unsigned long lastDataTime = 0;
const unsigned long DATA_INTERVAL = 1000; // Send data every 1000ms
float timeCounter = 0;
void setup() {
Serial.begin(9600);
delay(1000);
// TODO: Initialize your hardware pins and sensors here
Serial.println("DIYables ESP32 WebApp - Web Plotter Example");
// Add home and web plotter pages
webAppsServer.addApp(&homePage);
webAppsServer.addApp(&webPlotterPage);
// Optional: Add 404 page for better user experience
webAppsServer.setNotFoundPage(DIYablesNotFoundPage());
// Configure the plotter
webPlotterPage.setPlotTitle("Real-time Data Plotter");
webPlotterPage.setAxisLabels("Time (s)", "Values");
webPlotterPage.enableAutoScale(true);
webPlotterPage.setMaxSamples(50);
// Start the WebApp server
if (!webAppsServer.begin(WIFI_SSID, WIFI_PASSWORD)) {
while (1) {
Serial.println("Failed to start WebApp server!");
delay(1000);
}
}
// Set up callbacks
webPlotterPage.onPlotterDataRequest([]() {
Serial.println("Web client requested data");
sendSensorData();
});
Serial.println("\nWebPlotter is ready!");
Serial.println("Usage Instructions:");
Serial.println("1. Connect to the WiFi network");
Serial.println("2. Open your web browser");
Serial.println("3. Navigate to the Arduino's IP address");
Serial.println("4. Click on 'Web Plotter' to view real-time data");
Serial.println("\nGenerating simulated sensor data...");
}
void loop() {
// Handle web server and WebSocket connections
webAppsServer.loop();
// Send sensor data at regular intervals
if (millis() - lastDataTime >= DATA_INTERVAL) {
lastDataTime = millis();
sendSensorData();
timeCounter += DATA_INTERVAL / 1000.0; // Convert to seconds
}
}
void sendSensorData() {
// Generate simulated sensor data
// In a real application, replace these with actual sensor readings
// Simulated temperature sensor (sine wave with noise)
float temperature = 25.0 + 5.0 * sin(timeCounter * 0.5) + random(-100, 100) / 100.0;
// Simulated humidity sensor (cosine wave)
float humidity = 50.0 + 20.0 * cos(timeCounter * 0.3);
// Simulated light sensor (triangle wave)
float light = 512.0 + 300.0 * (2.0 * abs(fmod(timeCounter * 0.2, 2.0) - 1.0) - 1.0);
// Simulated analog pin reading
float analogValue = analogRead(A0);
// Send data using different methods:
// Method 1: Send individual values (uncomment to use)
// webPlotterPage.sendPlotData(temperature);
// Method 2: Send multiple values at once
webPlotterPage.sendPlotData(temperature, humidity, light / 10.0, analogValue / 100.0);
// Method 3: Send array of values (alternative approach)
// float values[] = {temperature, humidity, light / 10.0, analogValue / 100.0};
// webPlotterPage.sendPlotData(values, 4);
// Method 4: Send raw data string (for custom formatting)
// String dataLine = String(temperature, 2) + " " + String(humidity, 1) + " " + String(light / 10.0, 1);
// webPlotterPage.sendPlotData(dataLine);
// Print to Serial Monitor in Serial Plotter compatible format
// Format: Temperature Humidity Light Analog (tab-separated for Serial Plotter)
Serial.print(temperature, 1);
Serial.print("\t");
Serial.print(humidity, 1);
Serial.print("\t");
Serial.print(light / 10.0, 1);
Serial.print("\t");
Serial.println(analogValue / 100.0, 2);
}
- 스케치의 WiFi 자격 증명을 업데이트합니다:
const char WIFI_SSID[] = "YOUR_WIFI_NETWORK";
const char WIFI_PASSWORD[] = "YOUR_WIFI_PASSWORD";
- Arduino IDE의 Upload 버튼을 클릭하여 코드를 Arduino Nano ESP32에 업로드합니다
- 시리얼 모니터를 엽니다
- 시리얼 모니터 출력은 다음과 유사해야 합니다:
8
Serial.println("Hello World!");
Message (Enter to send message to 'Arduino Nano ESP32' on 'COM15')
New Line
9600 baud
DIYables WebApp - Web Plotter Example
INFO: Added app /
INFO: Added app /web-plotter
DIYables WebApp Library
Platform: Arduino Nano ESP32
Network connected!
IP address: 192.168.0.2
HTTP server started on port 80
Configuring WebSocket server callbacks...
WebSocket server started on port 81
WebSocket URL: ws://192.168.0.2:81
WebSocket server started on port 81
==========================================
DIYables WebApp Ready!
==========================================
Web Interface: http://192.168.0.2
WebSocket: ws://192.168.0.2:81
Available Applications:
Home Page: http://192.168.0.2/
Web Plotter: http://192.168.0.2/web-plotter
==========================================
- 아무것도 표시되지 않으면 보드의 리셋 버튼을 누르세요.
- 시리얼 모니터의 IP 주소를 동일한 네트워크의 브라우저에 입력합니다.
- 예: http://192.168.0.2
- 홈 페이지에 플로터 애플리케이션 카드가 표시됩니다:
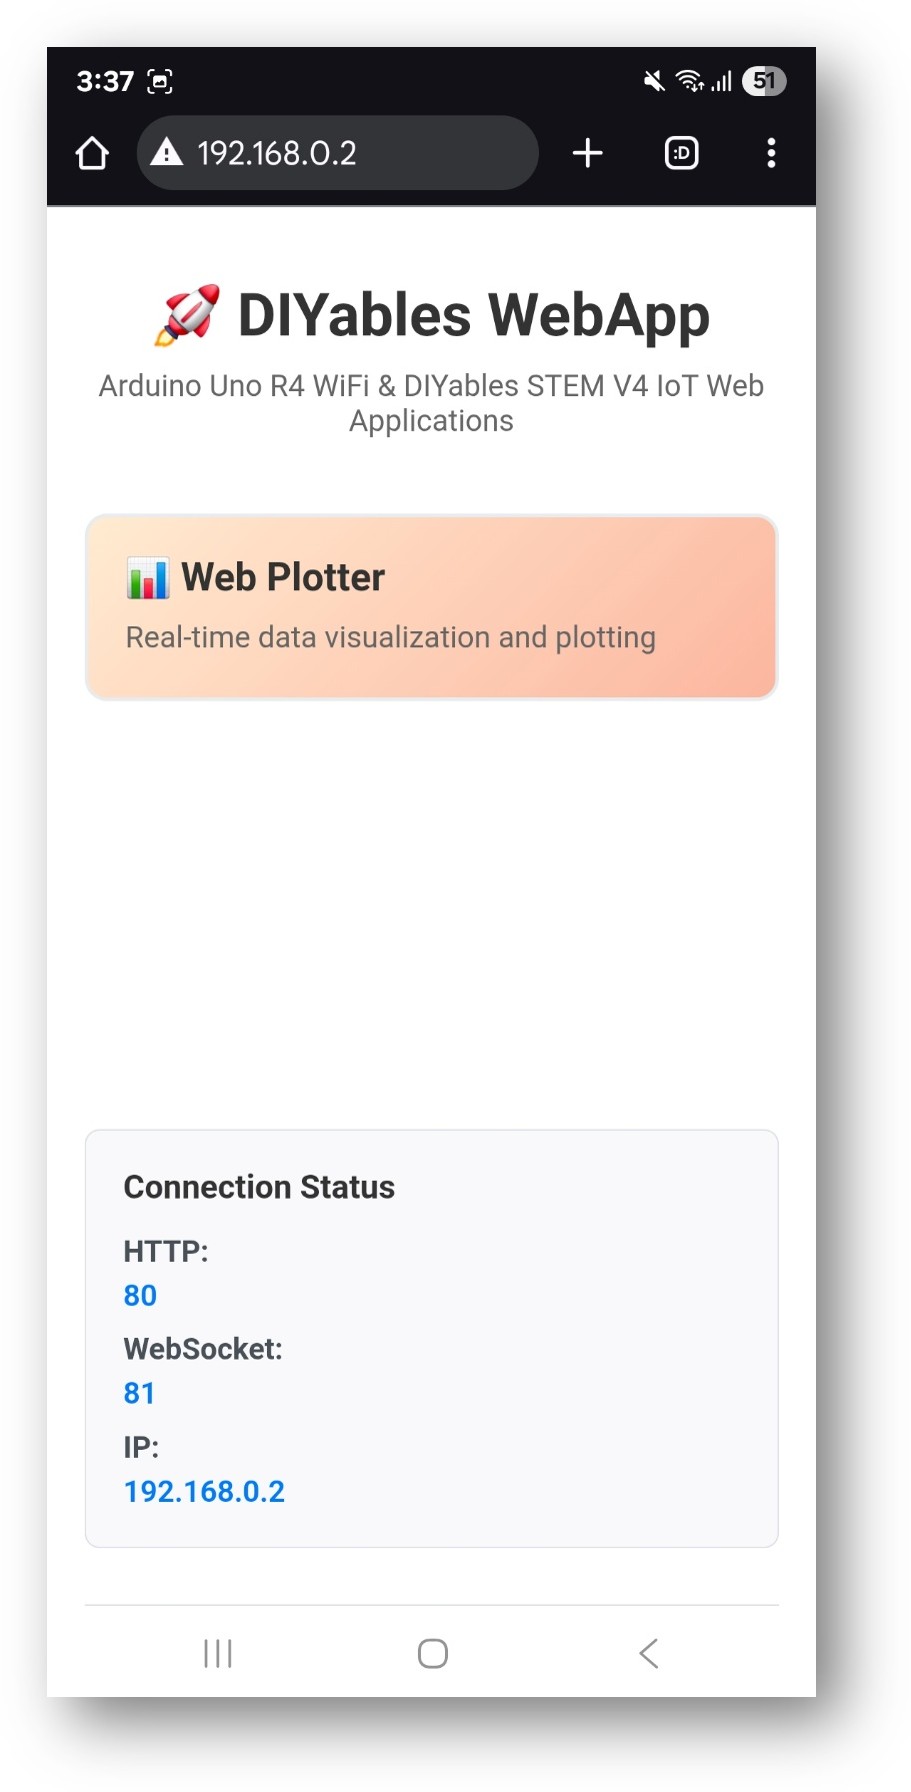
- 웹 플로터 카드를 선택하여 차트 페이지를 엽니다:
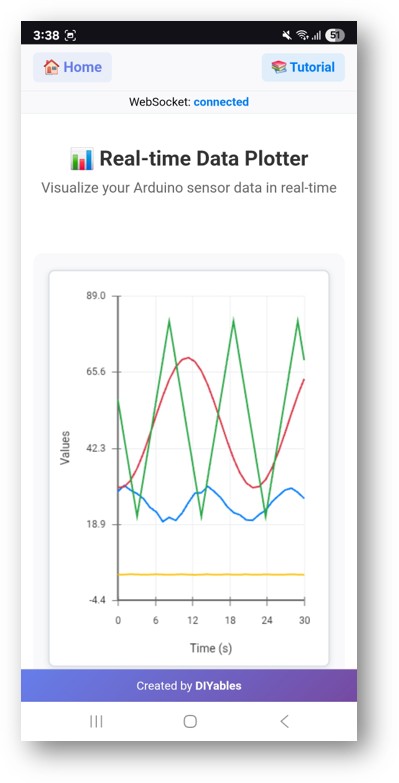
- 페이지는 http://192.168.0.2/web-plotter에서 직접 접근할 수도 있습니다.
- 스케치가 시뮬레이션 데이터를 보내면 차트가 업데이트되기 시작합니다. 각 시리즈는 별개의 색상으로 그려집니다.
플로터 구성
서버를 시작하기 전에 차트 제목, 축 레이블, 자동 스케일 동작, 최대 유지 샘플을 설정합니다:
webPlotterPage.setPlotTitle("Sensor Data");
webPlotterPage.setAxisLabels("Time (s)", "Value");
webPlotterPage.enableAutoScale(true);
webPlotterPage.setMaxSamples(100); // Keep last 100 points per series
데이터 포인트 보내기
각 데이터 포인트는 시리즈 이름, X 값, Y 값을 지정합니다. 처음 사용 시 시리즈가 자동으로 생성됩니다:
// Single series
webPlotterPage.addDataPoint("temperature", elapsedSeconds, sensorValue);
// Multiple series in the same update cycle
webPlotterPage.addDataPoint("temperature", t, tempValue);
webPlotterPage.addDataPoint("humidity", t, humValue);
webPlotterPage.addDataPoint("pressure", t, pressValue);
실제 센서에서 읽기
예제의 시뮬레이션 값을 실제 센서 읽음값으로 교체합니다:
단일 센서
float temperature = analogRead(A0) * (5.0 / 1023.0) * 100.0; // LM35
webPlotterPage.addDataPoint("LM35", millis() / 1000.0, temperature);
다중 센서
float temp = readTemperature();
float humid = readHumidity();
webPlotterPage.addDataPoint("Temp", millis() / 1000.0, temp);
webPlotterPage.addDataPoint("Humid", millis() / 1000.0, humid);
WebSocket 연결에 과부하가 걸리지 않도록 전송 속도를 제한합니다. 대부분의 센서 애플리케이션에는 500ms ~ 1000ms 간격이 적합합니다.
문제 해결
차트가 업데이트되지 않음
- webAppsServer.loop()가 모든 loop() 반복에서 실행되는지 확인합니다
- addDataPoint() 전에 Serial.println()을 추가하여 코드 경로가 실행되는지 확인합니다
- 브라우저 페이지를 다시 로드하고 WebSocket 연결 표시기를 확인합니다
차트에 평탄한 선 또는 잘못된 값이 표시됨
- 센서 읽기 및 스케일링 공식을 확인합니다
- 플로터에 보내는 것과 동시에 시리얼 모니터에도 값을 출력합니다
데이터 포인트가 너무 많아 브라우저가 느려짐
- setMaxSamples()를 낮춰 시리즈별 유지 포인트를 줄입니다
- 데이터 전송 사이의 지연을 늘립니다
보드에 접근할 수 없음
- 시리얼 모니터의 IP 주소를 확인합니다
- 브라우저 기기가 보드와 동일한 2.4GHz 네트워크에 있는지 확인합니다


