ESP32 WebPlotter 예제 실시간 데이터 시각화 튜토리얼
개요
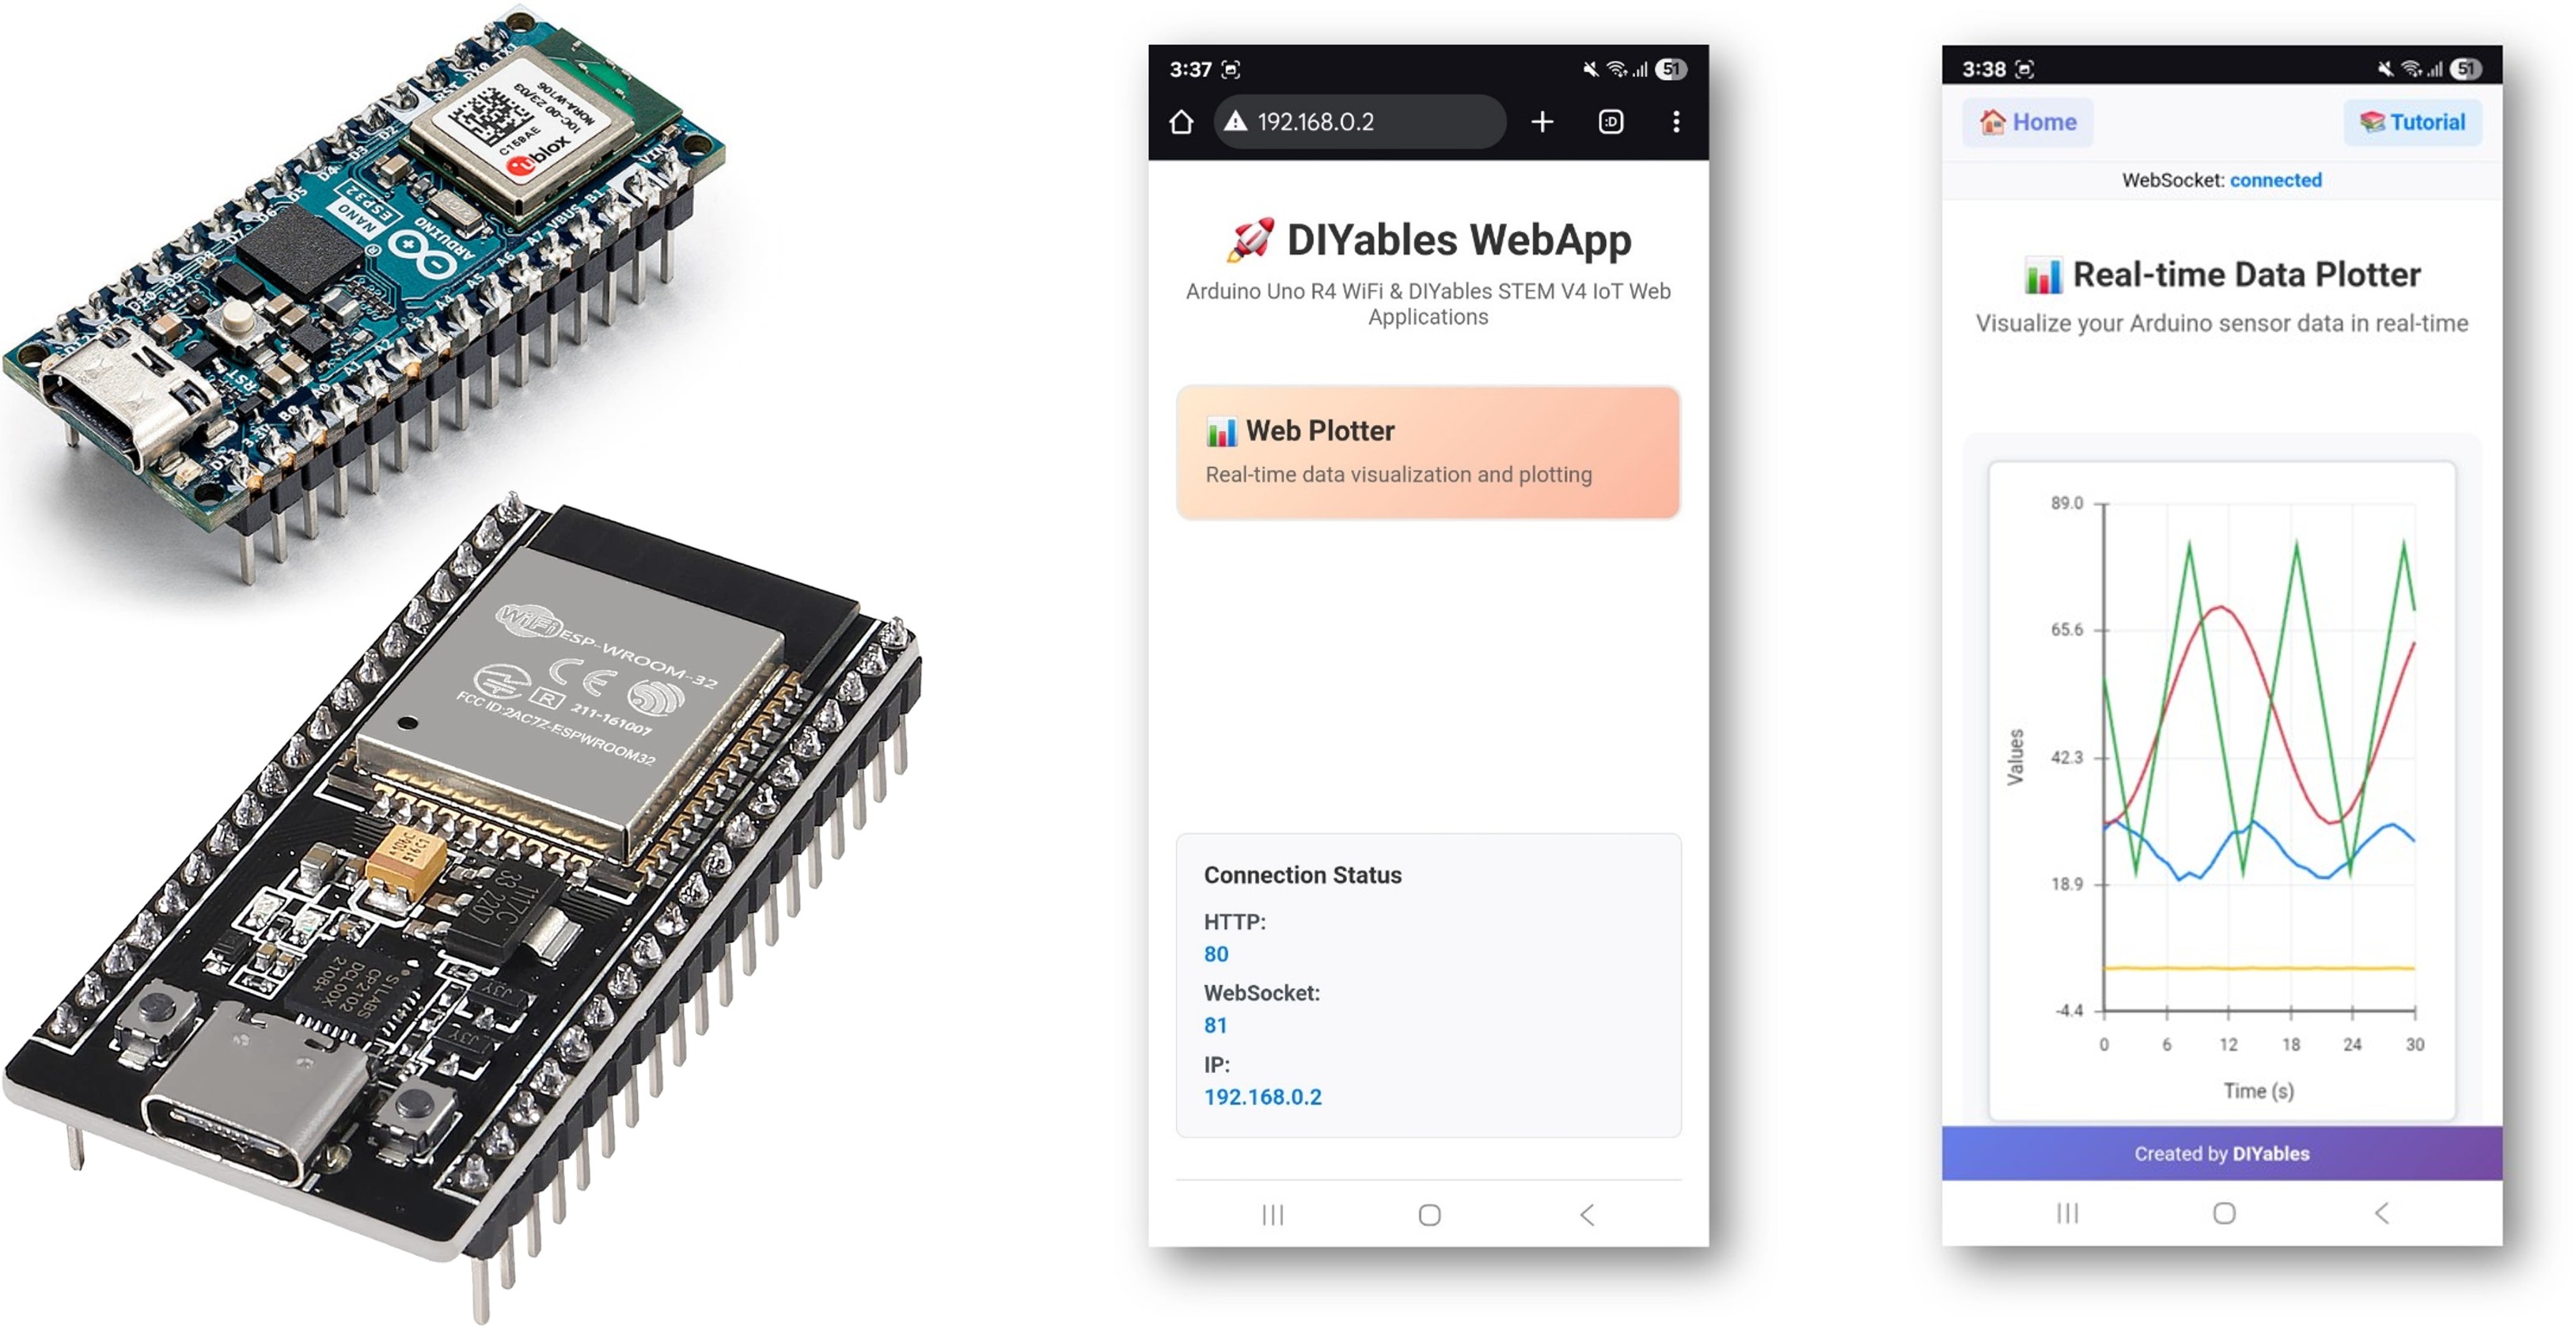
WebPlotter 예제는 모든 웹 브라우저에서 접근 가능한 실시간 데이터 시각화 인터페이스를 생성합니다. ESP32용으로 설계된 교육 플랫폼으로 향상된 데이터 처리 기능, 실시간 플로팅 기능, 그리고 센서 모니터링 시스템과의 원활한 통합을 제공합니다. 센서 데이터를 시각화하고, 알고리즘을 디버깅하며, 실시간으로 시스템 성능을 모니터링하는 데 적합합니다.
주요 기능
- 실시간 데이터 시각화: Arduino에서 스트리밍되는 센서 데이터를 실시간으로 시각화
- 여러 데이터 시리즈: 동시에 최대 8개의 서로 다른 데이터 스트림을 플로팅
- 자동 스케일링: 데이터 범위에 따라 Y축을 자동으로 스케일링
- 대화형 인터페이스: 확대, 이동 및 데이터 추세 분석
- WebSocket 통신: 최소 지연으로 즉시 업데이트
- 반응형 디자인: 데스크톱, 태블릿 및 모바일 기기에서 작동
- 맞춤형 구성: 플롯 제목, 축 레이블 및 범위를 조정 가능
준비물
| 1 | × | 38-pin ESP32 ESP-WROOM-32 Dev Module - Narrow | 쿠팡 | 아마존 | |
| 1 | × | (또는) 38-pin ESP32 ESP-WROOM-32 Dev Module - Wide | 쿠팡 | 아마존 | |
| 1 | × | (또는) 30-pin ESP32 ESP-WROOM-32 Dev Module - Wide | 아마존 | |
| 1 | × | (또는) ESP32 Uno-form board | 아마존 | |
| 1 | × | (또는) ESP32 S3 Uno-form board | 아마존 | |
| 1 | × | USB 케이블 타입-A to 타입-C (USB-A PC용) | 쿠팡 | 아마존 | |
| 1 | × | USB 케이블 타입-C to 타입-C (USB-C PC용) | 아마존 | |
| 1 | × | (추천) ESP32용 스크루 터미널 확장 보드 | 쿠팡 | 아마존 | |
| 1 | × | (추천) Breakout Expansion Board for ESP32 | 쿠팡 | 아마존 | |
| 1 | × | (추천) ESP32용 전원 분배기 | 쿠팡 | 아마존 |
공개: 이 포스팅 에 제공된 일부 링크는 아마존 제휴 링크입니다. 이 포스팅은 쿠팡 파트너스 활동의 일환으로, 이에 따른 일정액의 수수료를 제공받습니다.
설정 지침
빠른 단계
다음 지시를 단계별로 따라가세요:
- ESP32를 처음 사용하는 경우, ESP32 - 소프트웨어 설치을 참조하십시오.
- USB 케이블을 사용하여 ESP32 보드를 컴퓨터에 연결합니다.
- 컴퓨터에서 Arduino IDE를 실행합니다.
- 적절한 ESP32 보드(예: ESP32 Dev Module)와 COM 포트를 선택합니다.
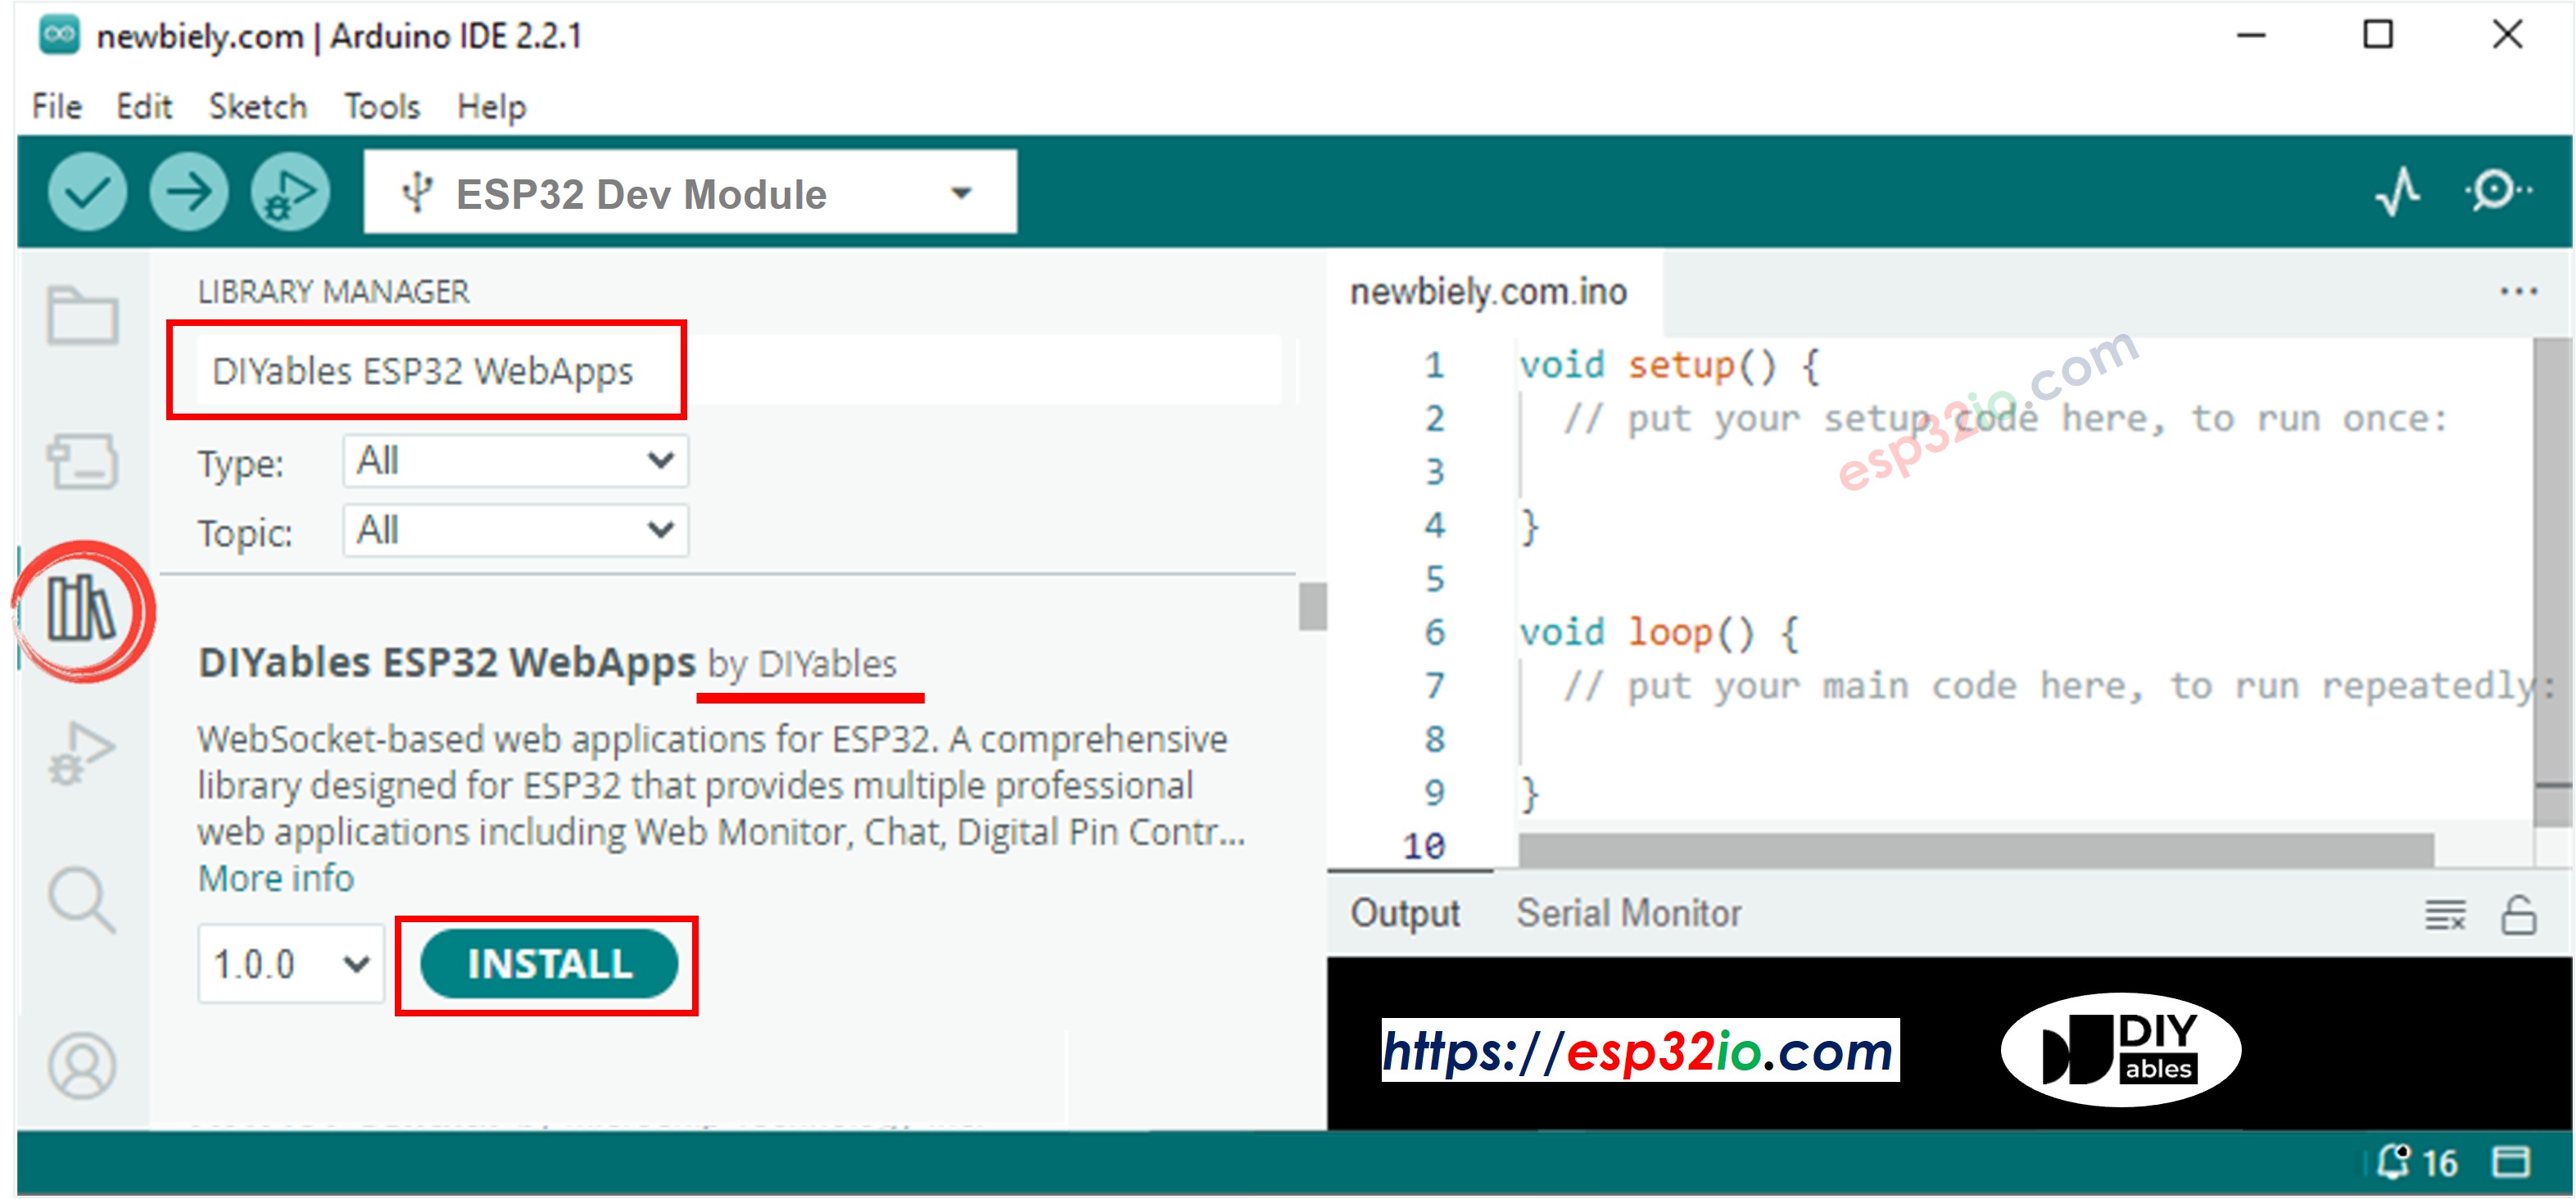
- Arduino IDE의 왼쪽 바에서 Libraries 아이콘으로 이동합니다.
- "DIYables ESP32 WebApps"를 검색한 다음, DIYables에서 제공하는 DIYables ESP32 WebApps 라이브러리를 찾으십시오.
- 라이브러리를 설치하려면 Install 버튼을 클릭합니다.
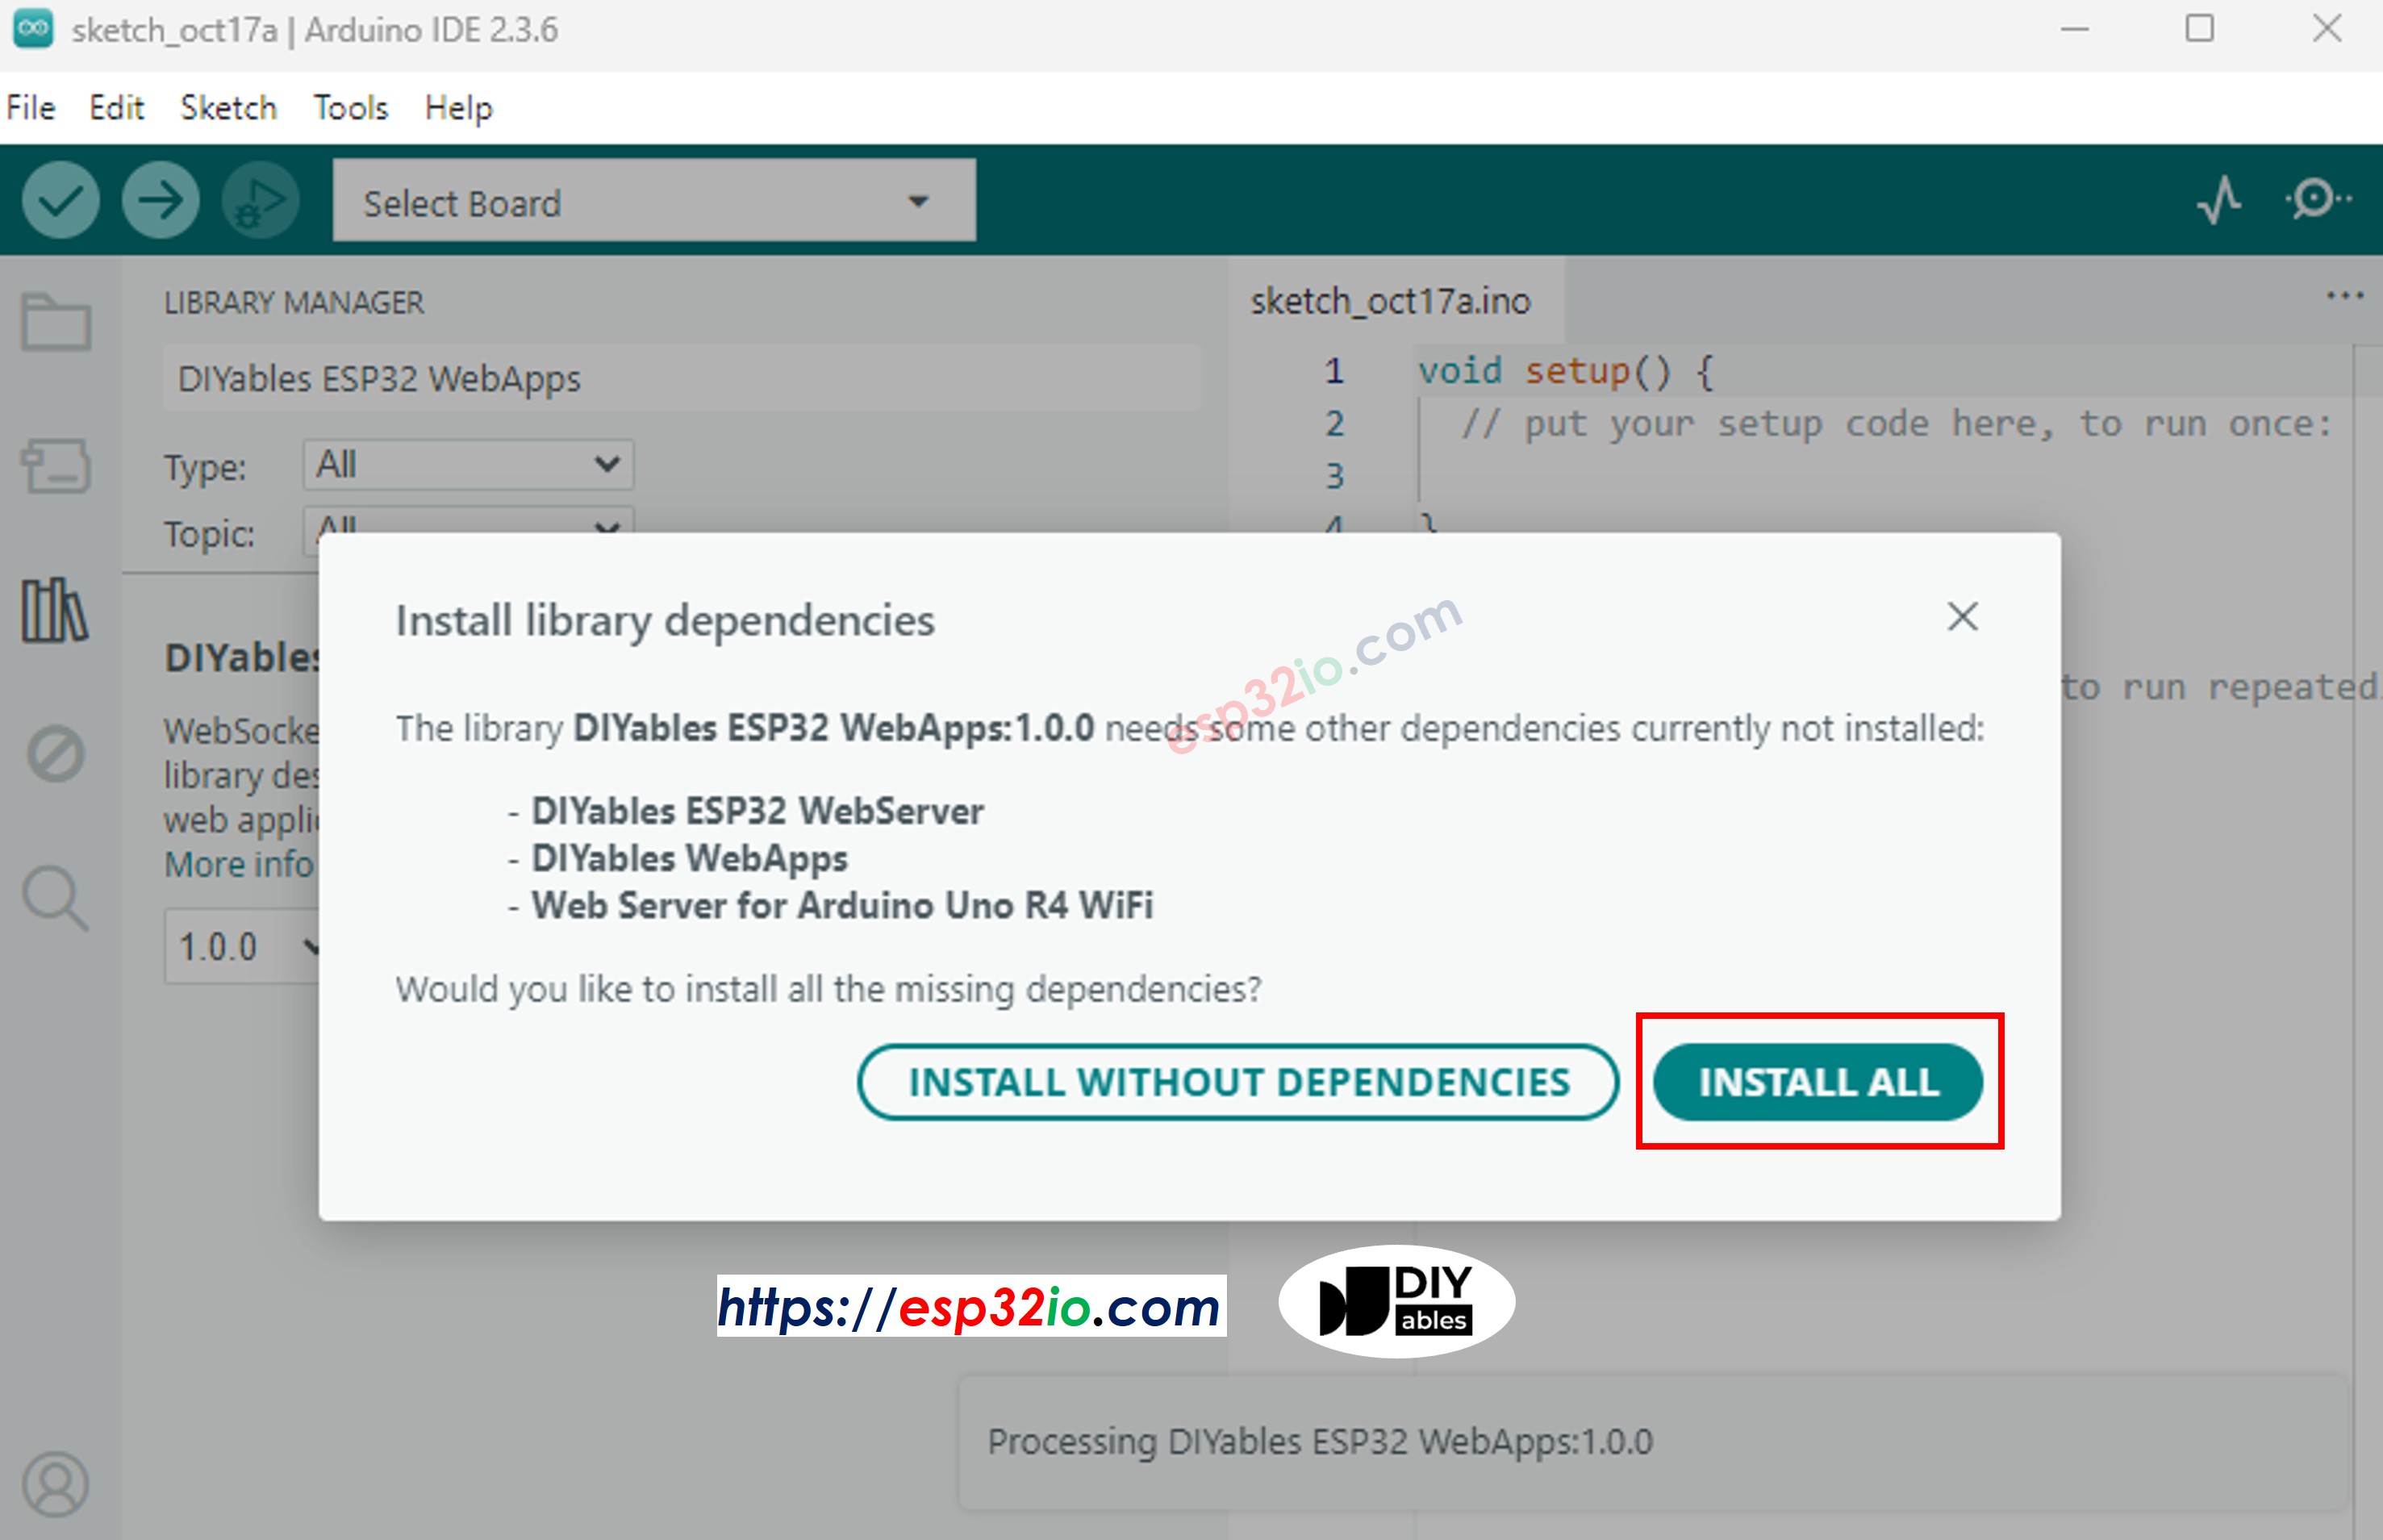
- 다른 라이브러리 의존성 설치를 요청받게 됩니다
- 모든 라이브러리 의존성을 설치하려면 Install All 버튼을 클릭하세요.
- Arduino IDE에서, File 예제 DIYables ESP32 WebApps WebPlotter 예제로 이동하거나, 위의 코드를 복사하여 Arduino IDE의 에디터에 붙여넣으세요
/*
* DIYables WebApp Library - Web Plotter Example
*
* This example demonstrates the Web Plotter feature:
* - Real-time data visualization
* - Multiple data series support
* - Auto-scaling Y-axis
* - Responsive web interface
* - WebSocket communication for instant updates
*
* Hardware: ESP32 Boards
*
* Setup:
* 1. Update WiFi credentials below
* 2. Upload the sketch to your Arduino
* 3. Open Serial Monitor to see the IP address
* 4. Navigate to http://[IP_ADDRESS]/webplotter
*/
#include <DIYables_ESP32_Platform.h>
#include <DIYablesWebApps.h>
// WiFi credentials - UPDATE THESE WITH YOUR NETWORK
const char WIFI_SSID[] = "YOUR_WIFI_SSID";
const char WIFI_PASSWORD[] = "YOUR_WIFI_PASSWORD";
// Create WebApp server and page instances
ESP32ServerFactory serverFactory;
DIYablesWebAppServer webAppsServer(serverFactory, 80, 81);
DIYablesHomePage homePage;
DIYablesWebPlotterPage webPlotterPage;
// Simulation variables
unsigned long lastDataTime = 0;
const unsigned long DATA_INTERVAL = 1000; // Send data every 1000ms
float timeCounter = 0;
void setup() {
Serial.begin(9600);
delay(1000);
// TODO: Initialize your hardware pins and sensors here
Serial.println("DIYables ESP32 WebApp - Web Plotter Example");
// Add home and web plotter pages
webAppsServer.addApp(&homePage);
webAppsServer.addApp(&webPlotterPage);
// Optional: Add 404 page for better user experience
webAppsServer.setNotFoundPage(DIYablesNotFoundPage());
// Configure the plotter
webPlotterPage.setPlotTitle("Real-time Data Plotter");
webPlotterPage.setAxisLabels("Time (s)", "Values");
webPlotterPage.enableAutoScale(true);
webPlotterPage.setMaxSamples(50);
// Start the WebApp server
if (!webAppsServer.begin(WIFI_SSID, WIFI_PASSWORD)) {
while (1) {
Serial.println("Failed to start WebApp server!");
delay(1000);
}
}
// Set up callbacks
webPlotterPage.onPlotterDataRequest([]() {
Serial.println("Web client requested data");
sendSensorData();
});
Serial.println("\nWebPlotter is ready!");
Serial.println("Usage Instructions:");
Serial.println("1. Connect to the WiFi network");
Serial.println("2. Open your web browser");
Serial.println("3. Navigate to the Arduino's IP address");
Serial.println("4. Click on 'Web Plotter' to view real-time data");
Serial.println("\nGenerating simulated sensor data...");
}
void loop() {
// Handle web server and WebSocket connections
webAppsServer.loop();
// Send sensor data at regular intervals
if (millis() - lastDataTime >= DATA_INTERVAL) {
lastDataTime = millis();
sendSensorData();
timeCounter += DATA_INTERVAL / 1000.0; // Convert to seconds
}
}
void sendSensorData() {
// Generate simulated sensor data
// In a real application, replace these with actual sensor readings
// Simulated temperature sensor (sine wave with noise)
float temperature = 25.0 + 5.0 * sin(timeCounter * 0.5) + random(-100, 100) / 100.0;
// Simulated humidity sensor (cosine wave)
float humidity = 50.0 + 20.0 * cos(timeCounter * 0.3);
// Simulated light sensor (triangle wave)
float light = 512.0 + 300.0 * (2.0 * abs(fmod(timeCounter * 0.2, 2.0) - 1.0) - 1.0);
// Simulated analog pin reading
float analogValue = analogRead(A0);
// Send data using different methods:
// Method 1: Send individual values (uncomment to use)
// webPlotterPage.sendPlotData(temperature);
// Method 2: Send multiple values at once
webPlotterPage.sendPlotData(temperature, humidity, light / 10.0, analogValue / 100.0);
// Method 3: Send array of values (alternative approach)
// float values[] = {temperature, humidity, light / 10.0, analogValue / 100.0};
// webPlotterPage.sendPlotData(values, 4);
// Method 4: Send raw data string (for custom formatting)
// String dataLine = String(temperature, 2) + " " + String(humidity, 1) + " " + String(light / 10.0, 1);
// webPlotterPage.sendPlotData(dataLine);
// Print to Serial Monitor in Serial Plotter compatible format
// Format: Temperature Humidity Light Analog (tab-separated for Serial Plotter)
Serial.print(temperature, 1);
Serial.print("\t");
Serial.print(humidity, 1);
Serial.print("\t");
Serial.print(light / 10.0, 1);
Serial.print("\t");
Serial.println(analogValue / 100.0, 2);
}
- 코드에서 와이파이 자격 증명을 구성하려면 다음 줄들을 업데이트하십시오:
const char WIFI_SSID[] = "YOUR_WIFI_NETWORK";
const char WIFI_PASSWORD[] = "YOUR_WIFI_PASSWORD";
- ESP32에 코드를 업로드하려면 Arduino IDE의 Upload 버튼을 클릭하세요.
- 시리얼 모니터를 여세요.
- 시리얼 모니터에서 결과를 확인하세요. 아래와 같이 보일 것입니다.
8
Serial.println("Hello World!");
Message (Enter to send message to 'ESP32 Dev Module' on 'COM15')
New Line
9600 baud
DIYables WebApp - Web Plotter Example
INFO: Added app /
INFO: Added app /web-plotter
DIYables WebApp Library
Platform: ESP32
Network connected!
IP address: 192.168.0.2
HTTP server started on port 80
Configuring WebSocket server callbacks...
WebSocket server started on port 81
WebSocket URL: ws://192.168.0.2:81
WebSocket server started on port 81
==========================================
DIYables WebApp Ready!
==========================================
📱 Web Interface: http://192.168.0.2
🔗 WebSocket: ws://192.168.0.2:81
📋 Available Applications:
🏠 Home Page: http://192.168.0.2/
📊 Web Plotter: http://192.168.0.2/web-plotter
==========================================
- 아무 것도 보이지 않으면 ESP32 보드를 재부팅하십시오.
- 표시된 IP 주소를 기록해 두고, 이 주소를 스마트폰이나 PC의 웹 브라우저 주소 표시줄에 입력하십시오.
- 예: http://192.168.0.2
- 아래 그림과 같은 홈 페이지가 표시됩니다.
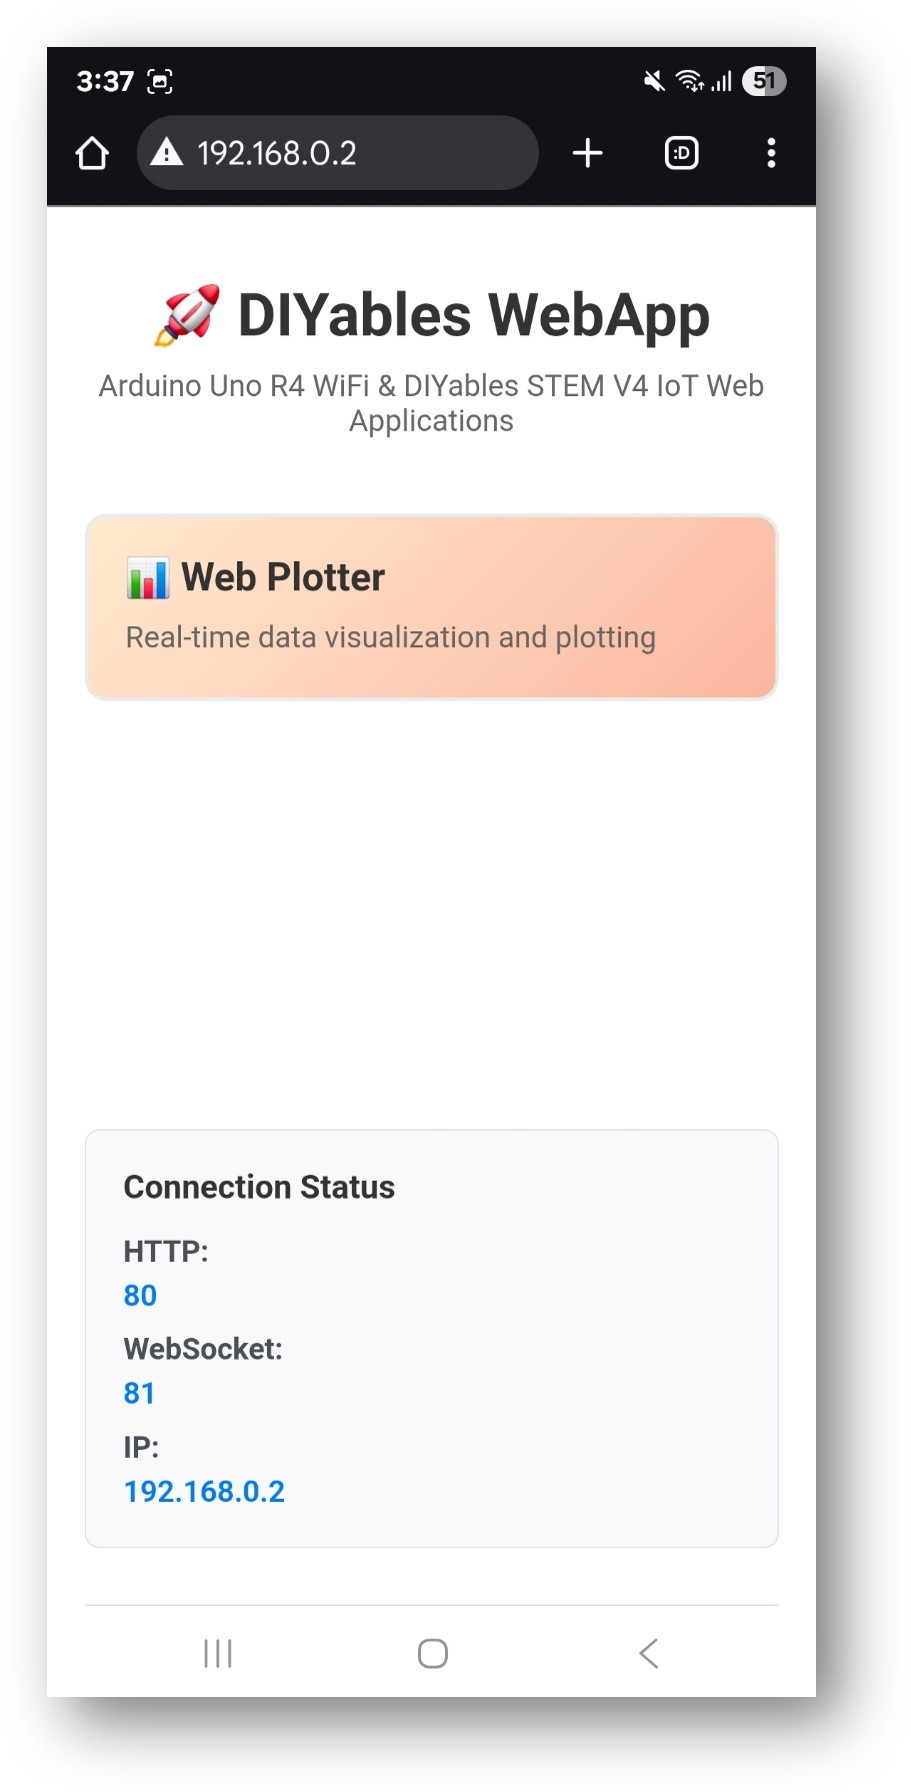
- Web Plotter 링크를 클릭하면 아래와 같은 Web Plotter 앱의 UI를 볼 수 있습니다:
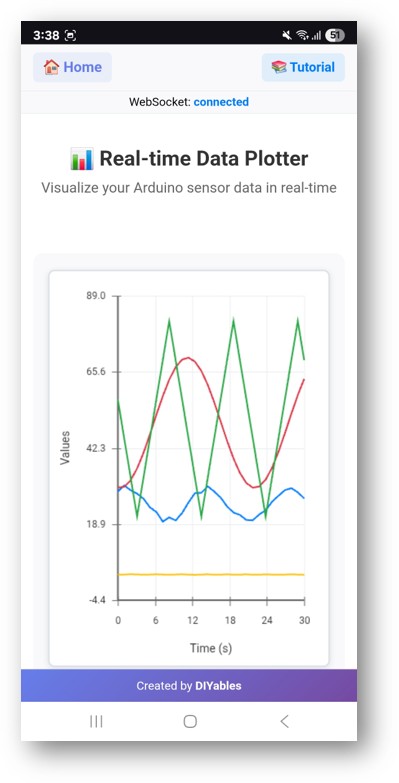
- IP 주소에 /web-plotter를 붙여 페이지에 직접 접속할 수도 있습니다. 예를 들어: http://192.168.0.2/web-plotter
- ESP32가 시뮬레이션된 센서 데이터를 생성하고 이를 실시간으로 그래프로 표시합니다. 서로 다른 데이터 스트림을 나타내는 여러 색상의 선이 보일 것입니다.
창의적 맞춤화 - 데이터를 창의적으로 시각화
당신의 고유한 프로젝트 요구사항에 맞게 플로팅 인터페이스를 변환하고 멋진 데이터 시각화를 만들어 보세요:
데이터 소스 구성
시뮬레이션된 데이터를 실제 센서 판독값으로 교체:
방법 1: 단일 센서 측정값
void sendTemperatureData() {
float temperature = analogRead(A0) * (5.0 / 1023.0) * 100; // LM35 temperature sensor
webPlotterPage.sendPlotData(temperature);
}
방법 2: 다중 센서
void sendMultipleSensors() {
float temperature = readTemperature();
float humidity = readHumidity();
float light = analogRead(A1) / 10.0;
float pressure = readPressure();
webPlotterPage.sendPlotData(temperature, humidity, light, pressure);
}
방법 3: 값의 배열
void sendSensorArray() {
float sensors[6] = {
analogRead(A0) / 10.0, // Sensor 1
analogRead(A1) / 10.0, // Sensor 2
analogRead(A2) / 10.0, // Sensor 3
digitalRead(2) * 50, // Digital state
millis() / 1000.0, // Time counter
random(0, 100) // Random data
};
webPlotterPage.sendPlotData(sensors, 6);
}
그래프 맞춤 설정
사용자 정의 플롯 외관
void setupCustomPlot() {
webPlotterPage.setPlotTitle("Environmental Monitoring Station");
webPlotterPage.setAxisLabels("Time (minutes)", "Sensor Readings");
webPlotterPage.setYAxisRange(0, 100); // Fixed Y-axis range
webPlotterPage.setMaxSamples(100); // Show more data points
}
동적 구성
void setupDynamicPlot() {
webPlotterPage.setPlotTitle("Smart Garden Monitor");
webPlotterPage.setAxisLabels("Sample #", "Values");
webPlotterPage.enableAutoScale(true); // Auto-adjust Y-axis
// Configure callbacks for interactive features
webPlotterPage.onPlotterDataRequest([]() {
Serial.println("Client connected - sending initial data");
sendInitialDataBurst();
});
}
고급 데이터 처리
이동 평균 필터
float movingAverage(float newValue) {
static float readings[10];
static int index = 0;
static float total = 0;
total -= readings[index];
readings[index] = newValue;
total += readings[index];
index = (index + 1) % 10;
return total / 10.0;
}
void sendFilteredData() {
float rawValue = analogRead(A0);
float filteredValue = movingAverage(rawValue);
webPlotterPage.sendPlotData(rawValue / 10.0, filteredValue / 10.0);
}
타임스탬프가 있는 데이터 로깅
void sendTimestampedData() {
unsigned long currentTime = millis() / 1000;
float sensorValue = analogRead(A0) / 10.0;
// Send time and value as separate data series
webPlotterPage.sendPlotData(currentTime, sensorValue);
// Also log to Serial for debugging
Serial.print("Time: ");
Serial.print(currentTime);
Serial.print("s, Value: ");
Serial.println(sensorValue);
}
연동 예제
환경 모니터링
#include <DHT.h>
#define DHT_PIN 2
#define DHT_TYPE DHT22
DHT dht(DHT_PIN, DHT_TYPE);
void sendEnvironmentalData() {
float temperature = dht.readTemperature();
float humidity = dht.readHumidity();
float lightLevel = analogRead(A0) / 10.0;
if (!isnan(temperature) && !isnan(humidity)) {
webPlotterPage.sendPlotData(temperature, humidity, lightLevel);
Serial.print("T: ");
Serial.print(temperature);
Serial.print("°C, H: ");
Serial.print(humidity);
Serial.print("%, Light: ");
Serial.println(lightLevel);
}
}
모터 제어 피드백
void sendMotorData() {
int motorSpeed = analogRead(A0); // Speed potentiometer
int currentDraw = analogRead(A1); // Current sensor
int motorPosition = digitalRead(2); // Position sensor
float speedPercent = (motorSpeed / 1023.0) * 100;
float currentAmps = (currentDraw / 1023.0) * 5.0;
float positionDegrees = motorPosition * 90;
webPlotterPage.sendPlotData(speedPercent, currentAmps, positionDegrees);
}
PID 제어기 시각화
float setpoint = 50.0;
float kp = 1.0, ki = 0.1, kd = 0.01;
float integral = 0, previousError = 0;
void sendPIDData() {
float input = analogRead(A0) / 10.0;
float error = setpoint - input;
integral += error;
float derivative = error - previousError;
float output = (kp * error) + (ki * integral) + (kd * derivative);
previousError = error;
// Plot setpoint, input, error, and output
webPlotterPage.sendPlotData(setpoint, input, error, output);
}
성능 최적화
효율적인 데이터 전송
unsigned long lastPlotUpdate = 0;
const unsigned long PLOT_INTERVAL = 100; // Update every 100ms
void efficientDataSending() {
if (millis() - lastPlotUpdate >= PLOT_INTERVAL) {
lastPlotUpdate = millis();
// Only send data at defined intervals
float value1 = analogRead(A0) / 10.0;
float value2 = analogRead(A1) / 10.0;
webPlotterPage.sendPlotData(value1, value2);
}
}
조건부 데이터 전송
float lastSentValue = 0;
const float CHANGE_THRESHOLD = 5.0;
void sendOnChange() {
float currentValue = analogRead(A0) / 10.0;
// Only send if value changed significantly
if (abs(currentValue - lastSentValue) > CHANGE_THRESHOLD) {
webPlotterPage.sendPlotData(currentValue);
lastSentValue = currentValue;
}
}
프로젝트 아이디어
과학적 응용
- 데이터 로거: 시간에 따라 온도, 습도, 기압 기록
- 진동 분석: 기계 시스템의 가속도계 데이터를 모니터링
- pH 모니터링: 아쿠아포닉스 시스템의 수질을 모니터링
- 태양광 패널 효율: 햇빛에 따른 전압/전류 출력 모니터링
교육 프로젝트
- 물리 실험: 진자 운동과 스프링 진동 시각화
- 화학 실험실: 반응 속도와 온도 변화 모니터링
- 생물학 연구: 식물 성장 센서와 환경 요인 추적
- 수학: 수학 함수 및 알고리즘 출력 그래프 그리기
가정 자동화
- 에너지 모니터링: 전력 소비 패턴 추적
- 정원 자동화: 토양 수분 및 조도 수준 모니터링
- HVAC 제어: 온도 및 습도 추세 시각화
- 보안 시스템: 모션 센서 활동 시각화
로봇공학 및 제어
- 로봇 내비게이션: 위치 및 방향 데이터 시각화
- 모터 제어: 속도, 토크 및 효율성 모니터링
- 센서 융합: 다중 센서 측정값 결합
- 경로 계획: 로봇 움직임 알고리즘 시각화
문제 해결
자주 발생하는 문제
1. 그래프에 데이터가 표시되지 않음
- Wi-Fi 연결 상태를 확인
- 브라우저 콘솔에서 WebSocket 연결을 확인
- 정기적으로 sendPlotData()가 호출되고 있는지 확인
- 시리얼 모니터에서 오류 메시지를 확인
2. 그래프가 들쑥날쑥하거나 불안정해 보입니다
- 데이터 필터링 구현(이동 평균)
- 데이터 전송 빈도 감소
- 센서 노이즈나 연결 문제 확인
- 전원 공급 안정성 확인
3. 브라우저 성능 문제
- 최대 샘플 수를 줄이기 (setMaxSamples())
- 데이터 전송 속도를 낮추기
- 다른 브라우저 탭을 닫기
- 브라우저에서 하드웨어 가속 사용하기
- WebSocket 연결 끊김
- 와이파이 신호 강도 확인
- 라우터 설정 확인(방화벽, 포트 차단)
- 사용자 정의 코드에 재연결 로직 구현
- ESP32 메모리 사용량 모니터링
디버깅 팁
자세한 로깅 활성화
void debugPlotterData() {
Serial.println("=== Plotter Debug Info ===");
Serial.print("Free RAM: ");
Serial.println(freeMemory());
Serial.print("Connected clients: ");
Serial.println(server.getConnectedClients());
Serial.print("Data rate: ");
Serial.println("Every " + String(DATA_INTERVAL) + "ms");
Serial.println("========================");
}
테스트 데이터 생성
void generateTestPattern() {
static float phase = 0;
float sine = sin(phase) * 50 + 50;
float cosine = cos(phase) * 30 + 70;
float triangle = (phase / PI) * 25 + 25;
webPlotterPage.sendPlotData(sine, cosine, triangle);
phase += 0.1;
if (phase > 2 * PI) phase = 0;
}
고급 기능
사용자 정의 데이터 형식화
void sendFormattedData() {
float temp = 25.5;
float humidity = 60.3;
// Create custom formatted data string
String dataLine = String(temp, 1) + "\t" + String(humidity, 1);
webPlotterPage.sendPlotData(dataLine);
}
다른 웹앱과의 통합
void setupMultipleApps() {
// Add multiple web applications
server.addApp(new DIYablesHomePage());
server.addApp(new DIYablesWebDigitalPinsPage());
server.addApp(new DIYablesWebSliderPage());
server.addApp(&webPlotterPage);
server.addApp(new DIYablesNotFoundPage());
// Configure interactions between apps
webSliderPage.onSliderValueFromWeb([](int slider1, int slider2) {
// Use slider values to control what gets plotted
float scaleFactor = slider1 / 255.0;
// ... plotting logic
});
}
실시간 제어 및 그래프 그리기
void controlAndPlot() {
// Read control inputs
int targetSpeed = analogRead(A0);
// Control hardware
analogWrite(9, targetSpeed / 4); // PWM output
// Read feedback
int actualSpeed = analogRead(A1);
int motorCurrent = analogRead(A2);
// Plot target vs actual
webPlotterPage.sendPlotData(
targetSpeed / 4.0, // Target speed
actualSpeed / 4.0, // Actual speed
motorCurrent / 10.0 // Current draw
);
}
다음 단계
WebPlotter 예제를 마스터한 후, 다음을 탐색하세요:
- MultipleWebApps - 그래프 작성을 제어 인터페이스와 결합하기
- WebMonitor - 그래프 작성과 함께 디버깅 기능 추가
- Custom Applications - 자신만의 전문 그래프 작성 도구를 구축하기
- Data Analysis - 시각화된 데이터에 대한 통계 분석 구현
지원
추가 도움이 필요하신 경우:
- API 참조 문서를 확인하세요
- DIYables 튜토리얼에 방문하세요: https://esp32io.com/tutorials/diyables-esp32-webapps
- ESP32 커뮤니티 포럼
- 브라우저 개발자 도구의 WebSocket 디버깅 도구


